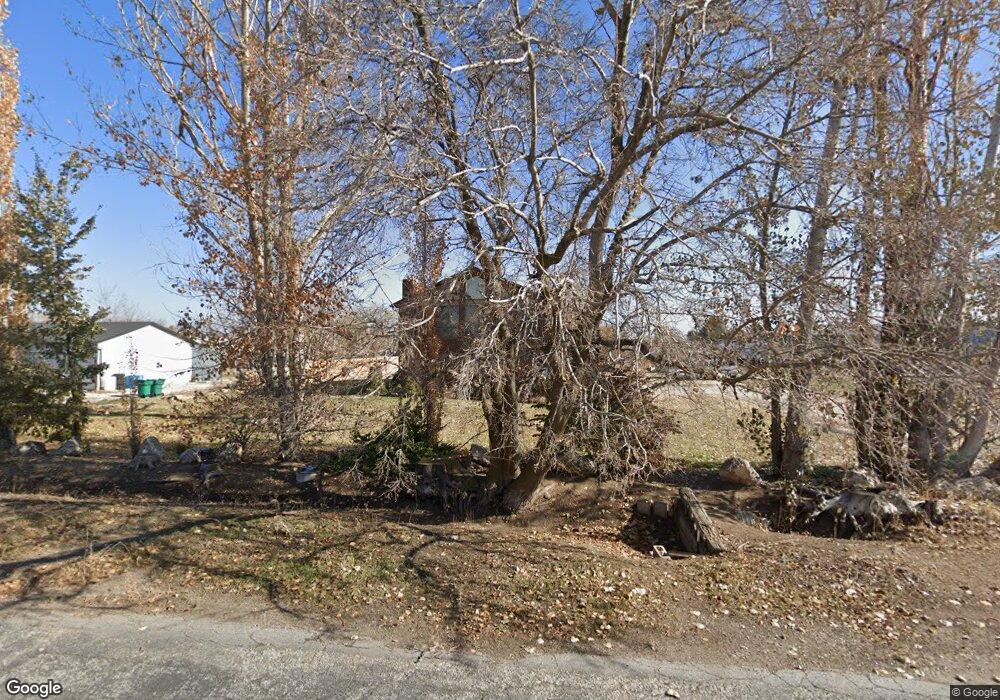
5670 S 6000 W Hooper, UT 84315
Estimated Value: $530,000 - $618,000
4
Beds
2
Baths
2,301
Sq Ft
$254/Sq Ft
Est. Value
About This Home
This home is located at 5670 S 6000 W, Hooper, UT 84315 and is currently estimated at $583,583, approximately $253 per square foot. 5670 S 6000 W is a home located in Weber County with nearby schools including Hooper Elementary School, Rocky Mountain Junior High School, and Quest Academy.
Ownership History
Date
Name
Owned For
Owner Type
Purchase Details
Closed on
Jan 22, 2019
Sold by
Manning Cherie and Fife Gerold
Bought by
Fife Gerold and Manning Cherie
Current Estimated Value
Home Financials for this Owner
Home Financials are based on the most recent Mortgage that was taken out on this home.
Original Mortgage
$223,000
Interest Rate
4.6%
Mortgage Type
New Conventional
Purchase Details
Closed on
Jul 20, 2004
Sold by
Manning Cherie
Bought by
Manning Cherie and Fife Gerold
Create a Home Valuation Report for This Property
The Home Valuation Report is an in-depth analysis detailing your home's value as well as a comparison with similar homes in the area
Home Values in the Area
Average Home Value in this Area
Purchase History
| Date | Buyer | Sale Price | Title Company |
|---|---|---|---|
| Fife Gerold | -- | Hickman Land Title Layton | |
| Manning Cherie | -- | First American Title |
Source: Public Records
Mortgage History
| Date | Status | Borrower | Loan Amount |
|---|---|---|---|
| Closed | Fife Gerold | $223,000 |
Source: Public Records
Tax History Compared to Growth
Tax History
| Year | Tax Paid | Tax Assessment Tax Assessment Total Assessment is a certain percentage of the fair market value that is determined by local assessors to be the total taxable value of land and additions on the property. | Land | Improvement |
|---|---|---|---|---|
| 2025 | $2,934 | $511,652 | $180,254 | $331,398 |
| 2024 | $2,827 | $276,099 | $99,139 | $176,960 |
| 2023 | $2,745 | $265,650 | $99,108 | $166,542 |
| 2022 | $2,644 | $261,800 | $77,097 | $184,703 |
| 2021 | $2,224 | $371,000 | $115,156 | $255,844 |
| 2020 | $2,126 | $325,000 | $80,167 | $244,833 |
| 2019 | $2,027 | $293,000 | $60,072 | $232,928 |
| 2018 | $1,830 | $253,000 | $57,045 | $195,955 |
| 2017 | $1,628 | $218,000 | $57,043 | $160,957 |
| 2016 | $1,449 | $104,756 | $27,574 | $77,182 |
| 2015 | $1,419 | $101,081 | $27,574 | $73,507 |
| 2014 | $1,448 | $100,315 | $35,835 | $64,480 |
Source: Public Records
Map
Nearby Homes
- 0 W 5500 S
- 6014 W 5300 S
- 6360 W 5500 S
- 5335 W 5500 S
- 5752 W 2425 N
- 3632 S 5400 W
- 6036 W 4700 S
- 3729 S 5600 W Unit 6
- 3720 S 5600 W Unit 2
- 3719 S 5600 W Unit 7
- 2084 N 4500 W
- 5319 S 7100 W
- 5801 S 7100 W
- 2462 N Hooded Crane Ct
- 4879 S 5050 W
- 2444 N Hooded Crane Cir Unit 11
- 4700 W 5500 S
- 4632 W 5750 S
- 4146 S 5800 W Unit 5
- 4163 S 5800 W Unit 2