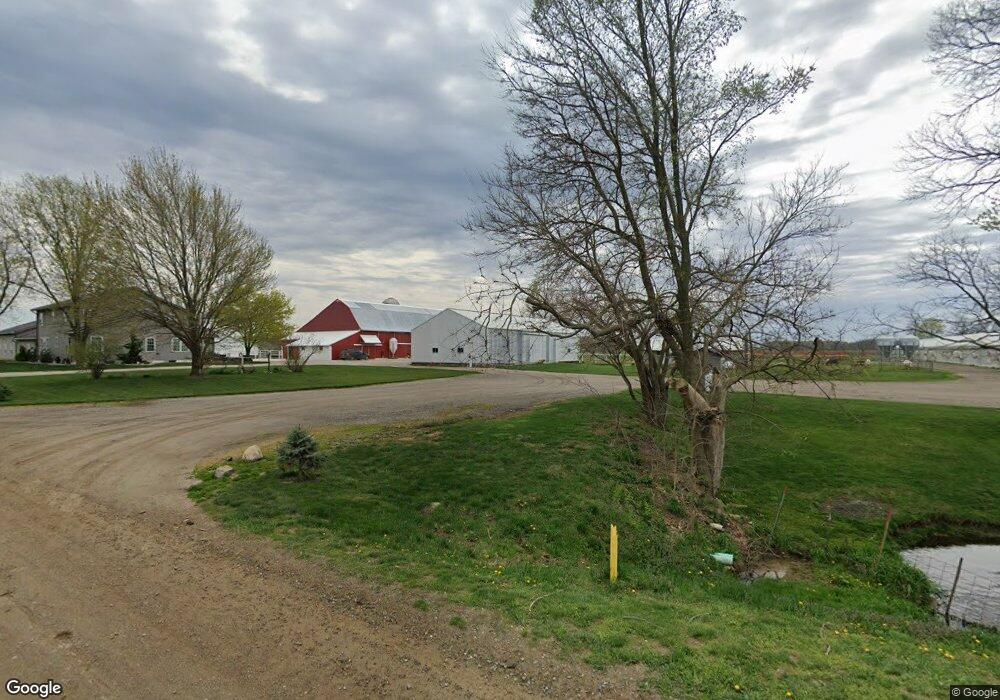
5670 W 300 S Topeka, IN 46571
Estimated Value: $265,000 - $1,452,166
5
Beds
3
Baths
3,824
Sq Ft
$225/Sq Ft
Est. Value
About This Home
This home is located at 5670 W 300 S, Topeka, IN 46571 and is currently estimated at $858,583, approximately $224 per square foot. 5670 W 300 S is a home located in LaGrange County with nearby schools including Shipshewana-Scott Elementary School, Westview Elementary School, and Westview Junior/Senior High School.
Ownership History
Date
Name
Owned For
Owner Type
Purchase Details
Closed on
Apr 2, 2025
Sold by
Yoder Glen H and Yoder Eileen Kay
Bought by
Yoder Family Revocable Trust and Yoder
Current Estimated Value
Purchase Details
Closed on
Dec 6, 2018
Sold by
Greenawalt Fredrie A
Bought by
Yoder Glen H
Home Financials for this Owner
Home Financials are based on the most recent Mortgage that was taken out on this home.
Original Mortgage
$400,000
Interest Rate
4.8%
Mortgage Type
New Conventional
Create a Home Valuation Report for This Property
The Home Valuation Report is an in-depth analysis detailing your home's value as well as a comparison with similar homes in the area
Purchase History
| Date | Buyer | Sale Price | Title Company |
|---|---|---|---|
| Yoder Family Revocable Trust | -- | None Listed On Document | |
| Yoder Glen H | $500,000 | Attorney Only |
Source: Public Records
Mortgage History
| Date | Status | Borrower | Loan Amount |
|---|---|---|---|
| Previous Owner | Yoder Glen H | $400,000 |
Source: Public Records
Tax History
| Year | Tax Paid | Tax Assessment Tax Assessment Total Assessment is a certain percentage of the fair market value that is determined by local assessors to be the total taxable value of land and additions on the property. | Land | Improvement |
|---|---|---|---|---|
| 2025 | $9,597 | $1,135,700 | $97,500 | $1,038,200 |
| 2024 | $9,597 | $1,143,700 | $102,600 | $1,041,100 |
| 2023 | $9,302 | $1,110,600 | $87,900 | $1,022,700 |
| 2022 | $9,429 | $1,101,700 | $70,600 | $1,031,100 |
| 2021 | $7,811 | $879,100 | $62,800 | $816,300 |
| 2020 | $7,887 | $868,900 | $62,500 | $806,400 |
| 2019 | $7,967 | $872,800 | $71,400 | $801,400 |
| 2018 | $8,341 | $890,200 | $73,000 | $817,200 |
| 2017 | $8,289 | $892,400 | $80,600 | $811,800 |
| 2016 | $7,112 | $684,300 | $82,000 | $602,300 |
| 2014 | $2,068 | $242,300 | $89,200 | $153,100 |
| 2013 | $2,068 | $234,800 | $79,900 | $154,900 |
Source: Public Records
Map
Nearby Homes
Your Personal Tour Guide
Ask me questions while you tour the home.