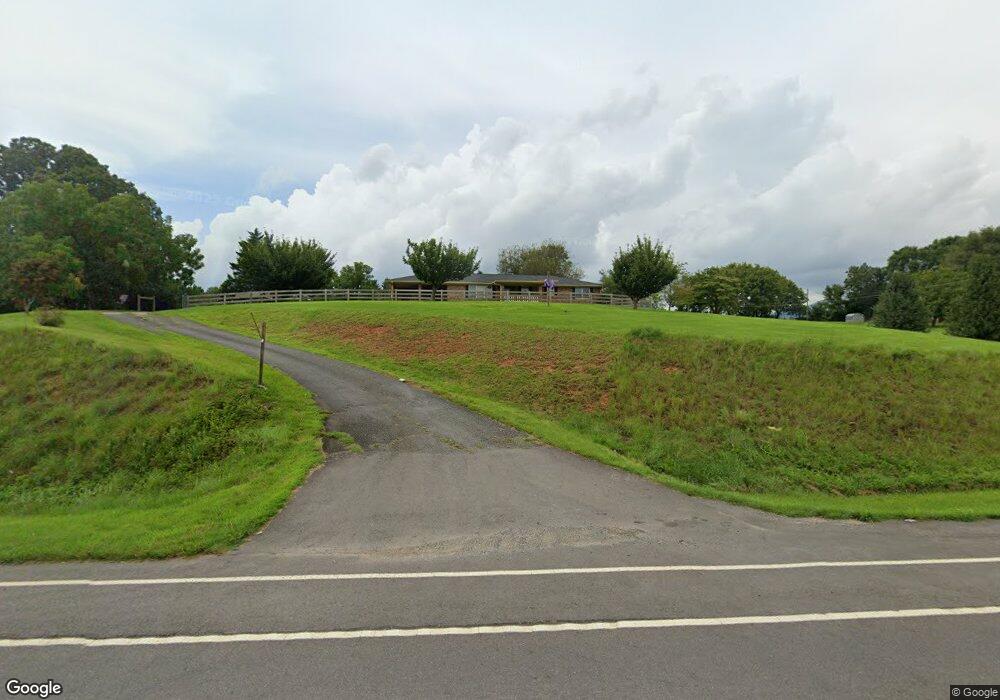
5671 Highway 52 E Ellijay, GA 30536
Estimated Value: $407,000 - $670,000
4
Beds
2
Baths
2,354
Sq Ft
$217/Sq Ft
Est. Value
About This Home
This home is located at 5671 Highway 52 E, Ellijay, GA 30536 and is currently estimated at $510,984, approximately $217 per square foot. 5671 Highway 52 E is a home located in Gilmer County with nearby schools including Ellijay Elementary School, Clear Creek Elementary School, and Clear Creek Middle School.
Ownership History
Date
Name
Owned For
Owner Type
Purchase Details
Closed on
Jul 9, 2021
Sold by
Masters Charlene M
Bought by
Paschal Tiffany Cheyenne
Current Estimated Value
Home Financials for this Owner
Home Financials are based on the most recent Mortgage that was taken out on this home.
Original Mortgage
$200,000
Outstanding Balance
$180,852
Interest Rate
2.96%
Mortgage Type
New Conventional
Estimated Equity
$330,132
Purchase Details
Closed on
Jan 26, 2016
Sold by
Clayton Jerry L
Bought by
Clayton Charlene M and Masters Billy
Purchase Details
Closed on
Apr 16, 2014
Sold by
Clayton Jerry L
Bought by
Clayton Jerry Lamar and Clayton Charlene M
Home Financials for this Owner
Home Financials are based on the most recent Mortgage that was taken out on this home.
Original Mortgage
$61,344
Interest Rate
4.37%
Mortgage Type
New Conventional
Purchase Details
Closed on
Jan 18, 2013
Sold by
Clayton Charlene M
Bought by
Clayton Jerry L
Purchase Details
Closed on
May 31, 2000
Sold by
Stover J E
Bought by
Clayton Jerry L
Create a Home Valuation Report for This Property
The Home Valuation Report is an in-depth analysis detailing your home's value as well as a comparison with similar homes in the area
Home Values in the Area
Average Home Value in this Area
Purchase History
| Date | Buyer | Sale Price | Title Company |
|---|---|---|---|
| Paschal Tiffany Cheyenne | $250,000 | -- | |
| Clayton Charlene M | -- | -- | |
| Clayton Jerry Lamar | -- | -- | |
| Clayton Jerry L | -- | -- | |
| Clayton Jerry L | $125,000 | -- |
Source: Public Records
Mortgage History
| Date | Status | Borrower | Loan Amount |
|---|---|---|---|
| Open | Paschal Tiffany Cheyenne | $200,000 | |
| Previous Owner | Clayton Jerry Lamar | $61,344 |
Source: Public Records
Tax History Compared to Growth
Tax History
| Year | Tax Paid | Tax Assessment Tax Assessment Total Assessment is a certain percentage of the fair market value that is determined by local assessors to be the total taxable value of land and additions on the property. | Land | Improvement |
|---|---|---|---|---|
| 2024 | $2,099 | $141,612 | $17,400 | $124,212 |
| 2023 | $2,049 | $128,080 | $14,600 | $113,480 |
| 2022 | $1,760 | $108,360 | $14,600 | $93,760 |
| 2021 | $1,560 | $78,600 | $12,320 | $66,280 |
| 2020 | $1,529 | $69,520 | $9,600 | $59,920 |
| 2019 | $1,574 | $69,520 | $9,600 | $59,920 |
| 2018 | $1,595 | $69,520 | $9,600 | $59,920 |
| 2017 | $1,231 | $50,040 | $7,680 | $42,360 |
| 2016 | $1,292 | $51,480 | $7,680 | $43,800 |
| 2015 | $1,289 | $52,280 | $4,600 | $47,680 |
| 2014 | $1,348 | $52,600 | $4,600 | $48,000 |
| 2013 | -- | $56,360 | $5,520 | $50,840 |
Source: Public Records
Map
Nearby Homes
- Lot 13 Ridgemont Dr
- Lot 21 Ridgemont Ln
- lot 22 Ridgemont Ln
- Lot 23 Ridgemont Ln
- 514 Ridgemont Dr
- 0 Big Creek Rd Unit 10611738
- 0 Big Creek Rd Unit 7654771
- 0 Big Creek Rd Unit 419038
- 198 Hollow Log Dr
- 105 Riveredge Dr
- 44 Cartecay Ct
- 439 Buck Creek Rd Lt 34
- 143 Hidden Lake Cir
- 83 Licklog Rd
- 4508 Owltown Rd
- 80 Stegall Mill Ridge
- 5711 Georgia 52
- 5687 Highway 52 E
- 5658 Highway 52 E
- 206 Ridgemont Dr
- LT 32 Ridgemont Dr
- LOT 3 Ridgemont Dr
- LOT29 Ridgemont Dr
- LT 16 Ridgemont Dr
- L 29 Ridgemont Dr
- LT 33 Ridgemont Dr
- 33 Ridgemont Dr
- 3 Ridgemont Dr
- Lot 33 Ridgemont Dr
- Lot 1 Ridgemont Dr
- 1 Ridgemont Dr
- Lot 32 Ridgemont Dr
- Lot 30 Ridgemont Dr
- Lot 28 Ridgemont Dr
- 5783 Highway 52 E
- 203 Ridgemont Dr