J
Seller's Agent in 2026
Jesus Chacon Duran
Megastar Realty
(720) 238-9348
1 in this area
3 Total Sales
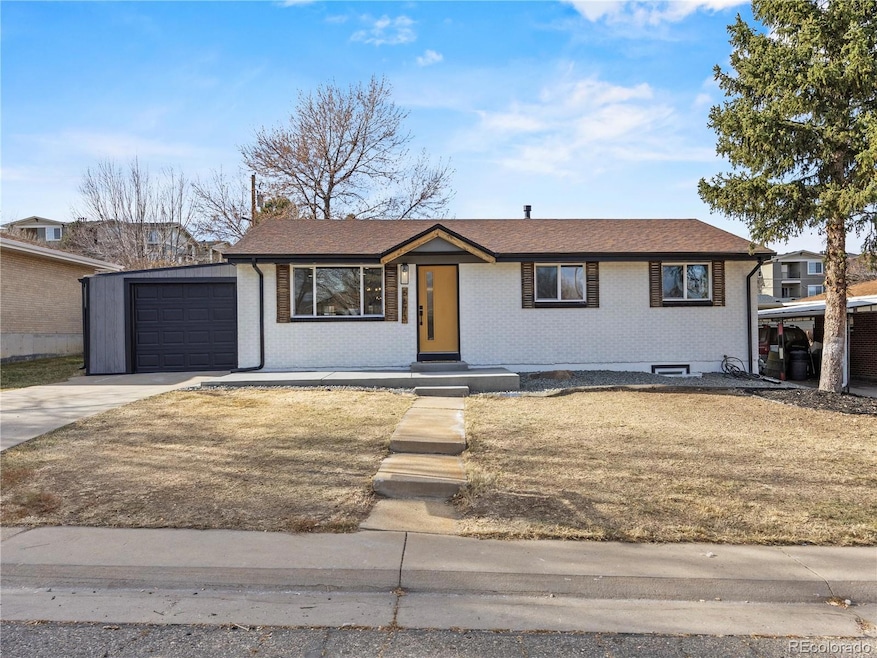


Step inside to discover a light filled main level featuring new high-quality finishes, fresh paint, and an open-concept layout ideal for everyday living and entertaining. The new remodeled kitchen features, high quality cabinetry, quartz countertops, stainless steel appliances, and a spacious island perfect for gatherings. This home offers 5 bedrooms and 2 1/2 bathrooms, a finished basement and spacious backyard. Located just minutes from Old Town Arvada, nice parks nearby, quick access to I-70, and much more. This updated home is move in ready and waiting for its new owner.
Last Agent to Sell the Property
Megastar Realty Brokerage Email: tonycorealtor@gmail.com,720-238-9348 License #100108803 Listed on: 11/20/2025
| Date | Type | Sale Price | Title Company |
|---|---|---|---|
| Warranty Deed | $715,000 | Htc (Heritage Title) | |
| Warranty Deed | $403,000 | Land Title Guarantee | |
| Special Warranty Deed | $400,000 | Land Title Guarantee | |
| Interfamily Deed Transfer | -- | Elevated Title | |
| Warranty Deed | $124,900 | First American | |
| Warranty Deed | $14,500 | -- | |
| Warranty Deed | $14,500 | -- | |
| Interfamily Deed Transfer | -- | -- |
| Date | Status | Loan Amount | Loan Type |
|---|---|---|---|
| Open | $693,550 | New Conventional | |
| Previous Owner | $516,110 | New Conventional | |
| Previous Owner | $174,048 | VA | |
| Previous Owner | $127,398 | VA |
| Date | Event | Price | List to Sale | Price per Sq Ft | Prior Sale |
|---|---|---|---|---|---|
| 02/02/2026 02/02/26 | Sold | $715,000 | 0.0% | $638 / Sq Ft | |
| 12/08/2025 12/08/25 | Price Changed | $715,000 | -1.4% | $638 / Sq Ft | |
| 11/20/2025 11/20/25 | For Sale | $725,000 | +81.3% | $647 / Sq Ft | |
| 08/14/2025 08/14/25 | Sold | $400,000 | -15.8% | $188 / Sq Ft | View Prior Sale |
| 07/31/2025 07/31/25 | Pending | -- | -- | -- | |
| 07/18/2025 07/18/25 | Price Changed | $475,000 | -5.0% | $223 / Sq Ft | |
| 07/12/2025 07/12/25 | For Sale | $499,900 | -- | $235 / Sq Ft |
| Year | Tax Paid | Tax Assessment Tax Assessment Total Assessment is a certain percentage of the fair market value that is determined by local assessors to be the total taxable value of land and additions on the property. | Land | Improvement |
|---|---|---|---|---|
| 2024 | $3,128 | $32,253 | $17,484 | $14,769 |
| 2023 | $3,128 | $32,253 | $17,484 | $14,769 |
| 2022 | $2,725 | $27,829 | $10,585 | $17,244 |
| 2021 | $2,771 | $28,631 | $10,890 | $17,741 |
| 2020 | $2,475 | $25,643 | $9,425 | $16,218 |
| 2019 | $2,441 | $25,643 | $9,425 | $16,218 |
| 2018 | $2,104 | $21,483 | $5,941 | $15,542 |
| 2017 | $1,926 | $21,483 | $5,941 | $15,542 |
| 2016 | $1,767 | $18,570 | $5,539 | $13,031 |
| 2015 | $1,427 | $18,570 | $5,539 | $13,031 |
| 2014 | $1,427 | $14,098 | $4,872 | $9,226 |
J
Seller's Agent in 2026
Jesus Chacon Duran
Megastar Realty
(720) 238-9348
1 in this area
3 Total Sales
S
Buyer's Agent in 2026
Stephanie Avozani
Atlas Real Estate Group
(336) 406-2280
1 in this area
6 Total Sales

Seller's Agent in 2025
Joe Zarrella
HomeSmart
(303) 332-6567
1 in this area
10 Total Sales
P
Buyer's Agent in 2025
Peter Pasque
HomeSmart Realty
(303) 618-7882
1 in this area
26 Total Sales
Source: REcolorado®
MLS Number: 8724572
APN: 39-103-08-004
Disclaimer: Certain information contained herein is derived from information provided by parties other than Homes.com. All information provided is deemed reliable, but is not guaranteed to be accurate and should be independently verified.
![]() Based on information submitted to the MLS GRID. All data is obtained from various sources and may not have been verified by broker or MLS GRID. Supplied Open House Information is subject to change without notice. All information should be independently reviewed and verified for accuracy. Properties may or may not be listed by the office/agent presenting the information. Some IDX listings have been excluded from this website. The content relating to real estate for sale in this Web site comes in part from the Internet Data eXchange (“IDX”) program of METROLIST, INC., DBA RECOLORADO®. Real estate listings held by brokers other than Ten-X are marked with the IDX Logo. This information is being provided for the consumers’ personal, non-commercial use and may not be used for any other purpose. All information is subject to change and should be independently verified.
Based on information submitted to the MLS GRID. All data is obtained from various sources and may not have been verified by broker or MLS GRID. Supplied Open House Information is subject to change without notice. All information should be independently reviewed and verified for accuracy. Properties may or may not be listed by the office/agent presenting the information. Some IDX listings have been excluded from this website. The content relating to real estate for sale in this Web site comes in part from the Internet Data eXchange (“IDX”) program of METROLIST, INC., DBA RECOLORADO®. Real estate listings held by brokers other than Ten-X are marked with the IDX Logo. This information is being provided for the consumers’ personal, non-commercial use and may not be used for any other purpose. All information is subject to change and should be independently verified.
This publication is designed to provide information with regard to the subject matter covered. It is displayed with the understanding that the publisher and authors are not engaged in rendering real estate, legal, accounting, tax, or other professional services and that the publisher and authors are not offering such advice in this publication. If real estate, legal, or other expert assistance is required, the services of a competent, professional person should be sought.
The information contained in this publication is subject to change without notice. METROLIST, INC., DBA RECOLORADO MAKES NO WARRANTY OF ANY KIND WITH REGARD TO THIS MATERIAL, INCLUDING, BUT NOT LIMITED TO, THE IMPLIED WARRANTIES OF MERCHANTABILITY AND FITNESS FOR A PARTICULAR PURPOSE. METROLIST, INC., DBA RECOLORADO SHALL NOT BE LIABLE FOR ERRORS CONTAINED HEREIN OR FOR ANY DAMAGES IN CONNECTION WITH THE FURNISHING, PERFORMANCE, OR USE OF THIS MATERIAL.
PUBLISHER’S NOTICE: All real estate advertised herein is subject to the Federal Fair Housing Act and the Colorado Fair Housing Act, which Acts make it illegal to make or publish any advertisement that indicates any preference, limitation, or discrimination based on race, color, religion, sex, handicap, familial status, or national origin.
METROLIST, INC., DBA RECOLORADO will not knowingly accept any advertising for real estate that is in violation of the law. All persons are hereby informed that all dwellings advertised are available on an equal opportunity basis.
© 2026 METROLIST, INC., DBA RECOLORADO® – All Rights Reserved. 6455 S. Yosemite St., Suite 500 Greenwood Village, CO 80111 USA
ALL RIGHTS RESERVED WORLDWIDE. No part of this publication may be reproduced, adapted, translated, stored in a retrieval system or transmitted in any form or by any means, electronic, mechanical, photocopying, recording, or otherwise, without the prior written permission of the publisher. The information contained herein including but not limited to all text, photographs, digital images, virtual tours, may be seeded and monitored for protection and tracking.
Based on information submitted to the MLS GRID
Ask me questions while you tour the home.