Estimated Value: $271,000 - $303,000
1
Bed
1
Bath
621
Sq Ft
$457/Sq Ft
Est. Value
About This Home
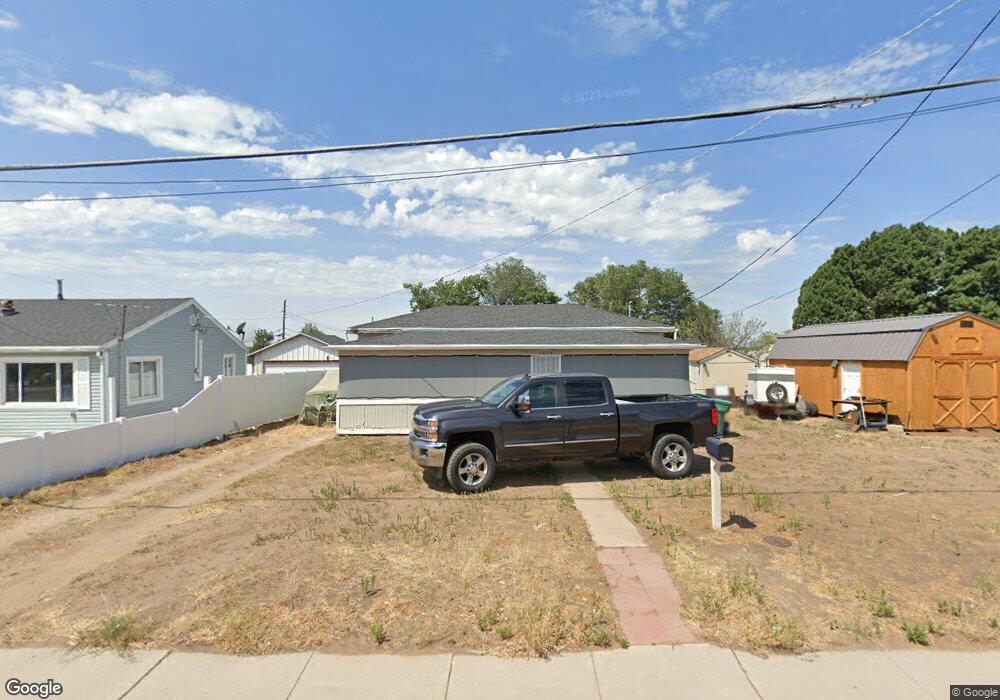
This home is located at 5673 S 2050 W, Roy, UT 84067 and is currently estimated at $283,773, approximately $456 per square foot. 5673 S 2050 W is a home located in Weber County with nearby schools including Municipal School, Roy Junior High School, and Roy High School.
Ownership History
Date
Name
Owned For
Owner Type
Purchase Details
Closed on
Jun 10, 2022
Sold by
Cody Fisher
Bought by
Fisher Cody and Fisher Charlene
Current Estimated Value
Home Financials for this Owner
Home Financials are based on the most recent Mortgage that was taken out on this home.
Original Mortgage
$188,237
Outstanding Balance
$179,108
Interest Rate
5.27%
Mortgage Type
FHA
Estimated Equity
$104,665
Purchase Details
Closed on
Jun 27, 2018
Sold by
Fts Management Llc
Bought by
Fisher Cody
Home Financials for this Owner
Home Financials are based on the most recent Mortgage that was taken out on this home.
Original Mortgage
$132,554
Interest Rate
4.75%
Mortgage Type
FHA
Purchase Details
Closed on
Dec 18, 2012
Sold by
Bluemontain Inc
Bought by
Fts Management Llc
Purchase Details
Closed on
Mar 3, 2000
Sold by
Klomp Emalee L and Klomp Terry H
Bought by
Klomp Terry H
Create a Home Valuation Report for This Property
The Home Valuation Report is an in-depth analysis detailing your home's value as well as a comparison with similar homes in the area
Home Values in the Area
Average Home Value in this Area
Purchase History
| Date | Buyer | Sale Price | Title Company |
|---|---|---|---|
| Fisher Cody | -- | Metro National Title | |
| Fisher Cody | -- | Vanguard Title Insurance Age | |
| Fts Management Llc | -- | Founders Title Company | |
| Klomp Terry H | -- | -- |
Source: Public Records
Mortgage History
| Date | Status | Borrower | Loan Amount |
|---|---|---|---|
| Open | Fisher Cody | $188,237 | |
| Previous Owner | Fisher Cody | $132,554 |
Source: Public Records
Tax History Compared to Growth
Tax History
| Year | Tax Paid | Tax Assessment Tax Assessment Total Assessment is a certain percentage of the fair market value that is determined by local assessors to be the total taxable value of land and additions on the property. | Land | Improvement |
|---|---|---|---|---|
| 2025 | $1,704 | $253,789 | $127,731 | $126,058 |
| 2024 | $1,677 | $138,599 | $70,260 | $68,339 |
| 2023 | $1,481 | $120,450 | $64,239 | $56,211 |
| 2022 | $1,464 | $123,200 | $55,729 | $67,471 |
| 2021 | $1,272 | $176,000 | $71,154 | $104,846 |
| 2020 | $1,122 | $141,000 | $71,154 | $69,846 |
| 2019 | $1,155 | $138,000 | $40,995 | $97,005 |
| 2018 | $775 | $79,000 | $38,976 | $40,024 |
| 2017 | $771 | $74,000 | $35,927 | $38,073 |
| 2016 | $753 | $38,831 | $17,548 | $21,283 |
| 2015 | $695 | $36,036 | $17,548 | $18,488 |
| 2014 | $672 | $34,190 | $17,548 | $16,642 |
Source: Public Records
Map
Nearby Homes
- 2146 W 5600 S Unit 29
- 5545 S 2100 W Unit 12
- 5545 S 2100 W Unit 20
- 5545 S 2100 W Unit D22
- 5643 S 2200 W
- 2184 W 5500 S
- 5902 S 1900 W
- 5333 S 2200 W
- 5289 S 2200 W
- 5810 S 2550 W
- 5261 S 2200 W
- 2632 2125 W
- 2622 N 175 W
- 428 W 2650 N
- 5345 S 2425 W
- 2606 N 2125 W
- 480 W 2650 N
- 484 W 2650 N
- 2588 N 2125 W
- 244 W 2575 N