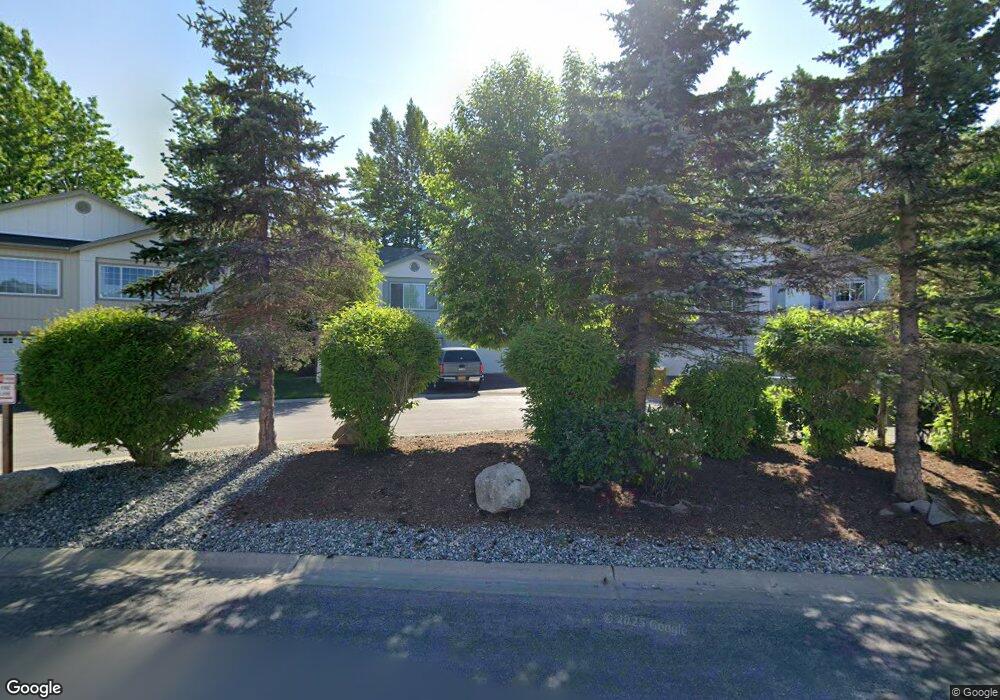
5673 Sapphire Loop Unit 25A Anchorage, AK 99504
Northeast Anchorage NeighborhoodEstimated Value: $231,000 - $329,843
2
Beds
2
Baths
1,484
Sq Ft
$189/Sq Ft
Est. Value
About This Home
This home is located at 5673 Sapphire Loop Unit 25A, Anchorage, AK 99504 and is currently estimated at $280,961, approximately $189 per square foot. 5673 Sapphire Loop Unit 25A is a home located in Anchorage Municipality with nearby schools including Nunaka Valley Elementary School, Clark Middle School, and Bartlett High School.
Ownership History
Date
Name
Owned For
Owner Type
Purchase Details
Closed on
May 7, 2009
Sold by
The Petersen Group Inc
Bought by
Logan Richard W
Current Estimated Value
Home Financials for this Owner
Home Financials are based on the most recent Mortgage that was taken out on this home.
Original Mortgage
$204,703
Outstanding Balance
$128,987
Interest Rate
4.8%
Mortgage Type
Purchase Money Mortgage
Estimated Equity
$151,974
Purchase Details
Closed on
Nov 12, 2008
Sold by
The Petersen Group Inc
Bought by
Cusick Robert Ardis
Home Financials for this Owner
Home Financials are based on the most recent Mortgage that was taken out on this home.
Original Mortgage
$232,801
Interest Rate
5.37%
Mortgage Type
FHA
Purchase Details
Closed on
Jun 9, 2006
Sold by
The Petersen Group Inc
Bought by
Whitaker Brian and Whitaker Sandra
Home Financials for this Owner
Home Financials are based on the most recent Mortgage that was taken out on this home.
Original Mortgage
$159,528
Interest Rate
2.75%
Mortgage Type
Purchase Money Mortgage
Create a Home Valuation Report for This Property
The Home Valuation Report is an in-depth analysis detailing your home's value as well as a comparison with similar homes in the area
Home Values in the Area
Average Home Value in this Area
Purchase History
| Date | Buyer | Sale Price | Title Company |
|---|---|---|---|
| Logan Richard W | -- | First American Title Ins Co | |
| Cusick Robert Ardis | -- | First American Title Ins Co | |
| Whitaker Brian | -- | First American Title Ins Co |
Source: Public Records
Mortgage History
| Date | Status | Borrower | Loan Amount |
|---|---|---|---|
| Open | Logan Richard W | $204,703 | |
| Previous Owner | Cusick Robert Ardis | $232,801 | |
| Previous Owner | Whitaker Brian | $159,528 |
Source: Public Records
Tax History Compared to Growth
Tax History
| Year | Tax Paid | Tax Assessment Tax Assessment Total Assessment is a certain percentage of the fair market value that is determined by local assessors to be the total taxable value of land and additions on the property. | Land | Improvement |
|---|---|---|---|---|
| 2025 | $597 | $300,000 | -- | $300,000 |
| 2024 | $597 | $262,000 | $0 | $262,000 |
| 2023 | $4,382 | $257,300 | $0 | $257,300 |
| 2022 | $796 | $246,600 | $0 | $246,600 |
| 2021 | $4,096 | $227,300 | $0 | $227,300 |
| 2020 | $562 | $230,300 | $0 | $230,300 |
| 2019 | $521 | $227,300 | $0 | $227,300 |
| 2018 | $3,153 | $240,300 | $0 | $240,300 |
| 2017 | $3,425 | $238,700 | $0 | $238,700 |
| 2016 | $3,117 | $240,200 | $0 | $240,200 |
| 2015 | $3,117 | $237,400 | $0 | $237,400 |
| 2014 | $3,117 | $228,200 | $0 | $228,200 |
Source: Public Records
Map
Nearby Homes
- 6030 Glenkerry Dr
- 5554 Sapphire Loop Unit 50B
- 6056 Doncaster Dr
- 6124 E 21st Ave
- 2731 Lee St
- 2718 Lee St
- 1601 Elmendorf Dr
- 3003 Ambergate Dr
- 5875 Kennyhill Dr
- 6410 E Northern Lights Blvd Unit 6A
- 6420 E Northern Lights Blvd Unit 7H
- 1507 Elmendorf Dr
- Slm L1 B1
- 1512 Atkinson Dr
- 1410 Richardson Dr
- 2601 Palmer Ct Unit D4
- 5013 Marlowe Ave
- 6546 Cimarron Cir
- 3215 Eastgate Place Unit 301
- 2441 Scarborough Dr
- 5675 Sapphire Loop
- 5675 Sapphire Loop Unit 25B
- 5667 Sapphire Loop Unit 24B
- 5665 Sapphire Loop Unit 24A
- 5665 Sapphire Loop Unit 24B
- 5683 Sapphire Loop Unit 26B
- 5681 Sapphire Loop Unit 26A
- 2326 Success Dr
- 5659 Sapphire Loop Unit 23B
- 5657 Sapphire Loop Unit 23A
- 5691 Sapphire Loop Unit 27B
- 5689 Sapphire Loop Unit 27A
- 5651 Sapphire Loop Unit 22B
- 5909 Prosperity Dr Unit 5909
- 5907 Prosperity Dr Unit 5907
- 5907 Prosperity Dr
- 2318 Success Dr
- 5649 Sapphire Loop Unit 22A
- 5674 Sapphire Loop Unit 75B
- 5676 Sapphire Loop Unit 75A