Estimated Value: $441,151 - $551,000
3
Beds
2
Baths
1,713
Sq Ft
$293/Sq Ft
Est. Value
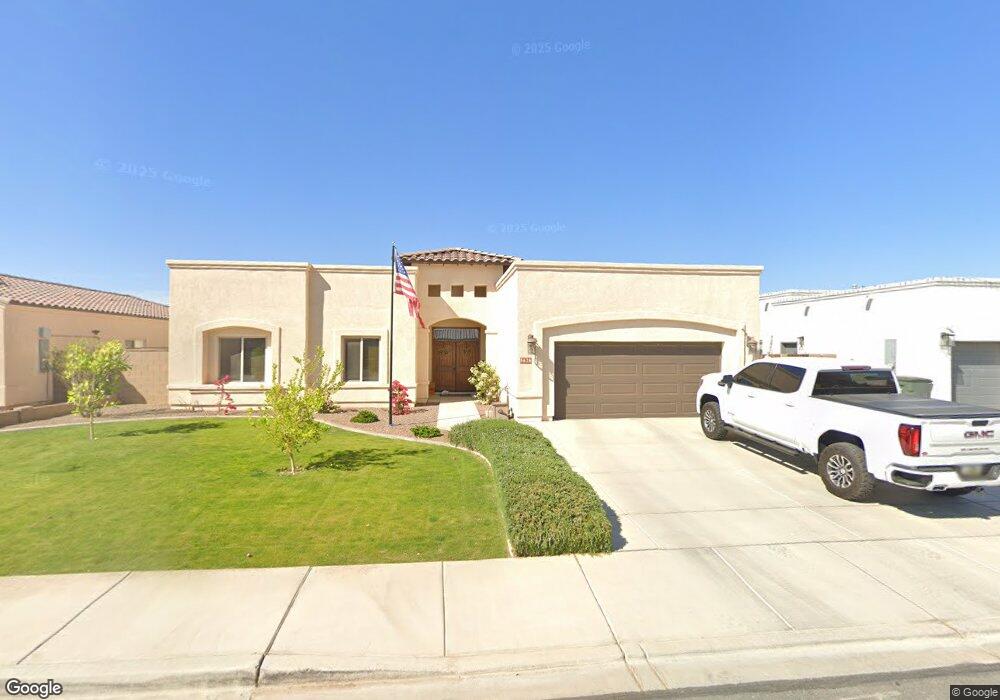
About This Home
This home is located at 5676 E 39th Ln, Yuma, AZ 85365 and is currently estimated at $501,788, approximately $292 per square foot. 5676 E 39th Ln is a home located in Yuma County with nearby schools including James B. Rolle Elementary School, Gila Vista Junior High School, and Yuma High School.
Ownership History
Date
Name
Owned For
Owner Type
Purchase Details
Closed on
Jun 27, 2018
Sold by
Pioneer Title Agency Inc
Bought by
Perricone Development Group Ii L L C
Current Estimated Value
Home Financials for this Owner
Home Financials are based on the most recent Mortgage that was taken out on this home.
Original Mortgage
$252,928
Outstanding Balance
$216,931
Interest Rate
4.6%
Mortgage Type
New Conventional
Estimated Equity
$284,857
Purchase Details
Closed on
Jun 12, 2018
Sold by
Perricone Development Group Ii L L C
Bought by
Guerra Edgar O and Guerra Ashley N
Home Financials for this Owner
Home Financials are based on the most recent Mortgage that was taken out on this home.
Original Mortgage
$252,928
Outstanding Balance
$216,931
Interest Rate
4.6%
Mortgage Type
New Conventional
Estimated Equity
$284,857
Purchase Details
Closed on
Oct 10, 2013
Sold by
Lgj Yuma Inc
Bought by
Pioneer Title Agency Inc
Create a Home Valuation Report for This Property
The Home Valuation Report is an in-depth analysis detailing your home's value as well as a comparison with similar homes in the area
Purchase History
| Date | Buyer | Sale Price | Title Company |
|---|---|---|---|
| Perricone Development Group Ii L L C | -- | Pioneer Title Agency Inc | |
| Guerra Edgar O | $281,030 | Pioneer Title Agency Inc | |
| Pioneer Title Agency Inc | -- | Pioneer Title Agency Inc | |
| Lgj Yuma Inc | -- | Pioneer Title Agency Inc |
Source: Public Records
Mortgage History
| Date | Status | Borrower | Loan Amount |
|---|---|---|---|
| Open | Guerra Edgar O | $252,928 |
Source: Public Records
Tax History
| Year | Tax Paid | Tax Assessment Tax Assessment Total Assessment is a certain percentage of the fair market value that is determined by local assessors to be the total taxable value of land and additions on the property. | Land | Improvement |
|---|---|---|---|---|
| 2026 | $3,036 | $28,983 | $7,180 | $21,803 |
| 2025 | $2,940 | $27,604 | $6,830 | $20,774 |
| 2024 | $2,862 | $26,289 | $6,630 | $19,659 |
| 2023 | $2,862 | $25,037 | $6,449 | $18,588 |
| 2022 | $2,765 | $23,845 | $6,655 | $17,190 |
| 2021 | $2,924 | $22,709 | $6,292 | $16,417 |
| 2020 | $3,042 | $21,628 | $4,623 | $17,005 |
| 2019 | $2,987 | $20,598 | $4,029 | $16,569 |
| 2018 | $525 | $3,113 | $3,113 | $0 |
| 2017 | $529 | $3,113 | $3,113 | $0 |
| 2016 | $542 | $3,002 | $3,002 | $0 |
| 2015 | $496 | $3,049 | $3,049 | $0 |
| 2014 | $496 | $2,904 | $2,904 | $0 |
Source: Public Records
Map
Nearby Homes
- 5676 E 39th Ln
- 5662 E 39th Ln
- 5690 E 39th Ln
- 5662 E 39th Ln
- 5675 E 39th Place
- 5689 E 39th Place
- 5646 E 39th Ln
- 5661 E 39th Place
- 5677 E 39th Ln
- 5663 E 39th Ln
- 5647 E 39th Ln
- 3965 S Bella Vista Dr
- 5632 E 39th Ln
- 5632 E 39th Ln
- 3947 S Bella Vista Dr
- 3981 S Bella Vista Dr
- 5674 E 39th Place
- 5655 E 39th Place
- 5688 E 39th Place
- 3997 S Bella Vista Dr
Your Personal Tour Guide
Ask me questions while you tour the home.