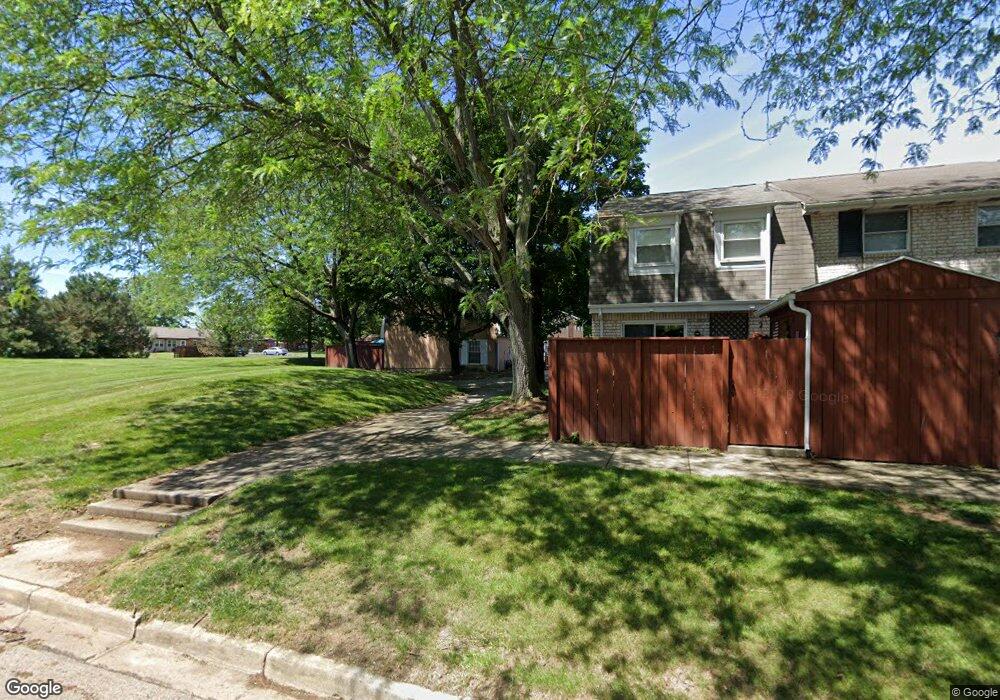
568 Adrian Ct Brookville, OH 45309
Estimated Value: $82,000 - $170,000
2
Beds
2
Baths
1,188
Sq Ft
$97/Sq Ft
Est. Value
About This Home
This home is located at 568 Adrian Ct, Brookville, OH 45309 and is currently estimated at $114,913, approximately $96 per square foot. 568 Adrian Ct is a home located in Montgomery County with nearby schools including Brookville Elementary School, Brookville Intermediate School, and Brookville High School.
Ownership History
Date
Name
Owned For
Owner Type
Purchase Details
Closed on
Jan 28, 2022
Sold by
Randall R Shaffer Llc
Bought by
Sacksteder Thomas M
Current Estimated Value
Home Financials for this Owner
Home Financials are based on the most recent Mortgage that was taken out on this home.
Original Mortgage
$3,600
Outstanding Balance
$3,343
Interest Rate
3.55%
Mortgage Type
New Conventional
Estimated Equity
$111,570
Purchase Details
Closed on
Mar 17, 2017
Sold by
Moran Michael A and Moran Cynthia L
Bought by
Randall R Shaffer Llc
Home Financials for this Owner
Home Financials are based on the most recent Mortgage that was taken out on this home.
Original Mortgage
$41,600
Interest Rate
4.17%
Mortgage Type
Future Advance Clause Open End Mortgage
Purchase Details
Closed on
Oct 22, 2008
Sold by
Riley Kenneth L and Riley Patricia A
Bought by
Monnin David P and Monnin Christine M
Create a Home Valuation Report for This Property
The Home Valuation Report is an in-depth analysis detailing your home's value as well as a comparison with similar homes in the area
Home Values in the Area
Average Home Value in this Area
Purchase History
| Date | Buyer | Sale Price | Title Company |
|---|---|---|---|
| Sacksteder Thomas M | -- | None Listed On Document | |
| Randall R Shaffer Llc | $52,000 | Safemark Title Agency Inc | |
| Monnin David P | $72,500 | None Available |
Source: Public Records
Mortgage History
| Date | Status | Borrower | Loan Amount |
|---|---|---|---|
| Open | Sacksteder Thomas M | $3,600 | |
| Open | Sacksteder Thomas M | $70,695 | |
| Previous Owner | Randall R Shaffer Llc | $41,600 |
Source: Public Records
Tax History Compared to Growth
Tax History
| Year | Tax Paid | Tax Assessment Tax Assessment Total Assessment is a certain percentage of the fair market value that is determined by local assessors to be the total taxable value of land and additions on the property. | Land | Improvement |
|---|---|---|---|---|
| 2024 | $600 | $22,160 | $5,340 | $16,820 |
| 2023 | $600 | $22,160 | $5,340 | $16,820 |
| 2022 | $1,224 | $19,620 | $4,730 | $14,890 |
| 2021 | $1,229 | $19,620 | $4,730 | $14,890 |
| 2020 | $1,231 | $19,620 | $4,730 | $14,890 |
| 2019 | $1,300 | $19,010 | $3,550 | $15,460 |
| 2018 | $1,307 | $19,010 | $3,550 | $15,460 |
| 2017 | $1,303 | $19,010 | $3,550 | $15,460 |
| 2016 | $1,503 | $22,100 | $4,730 | $17,370 |
| 2015 | $1,479 | $22,100 | $4,730 | $17,370 |
| 2014 | $1,479 | $22,100 | $4,730 | $17,370 |
| 2012 | -- | $22,430 | $4,730 | $17,700 |
Source: Public Records
Map
Nearby Homes
- 525 Adrian Ct
- 573 Arlington Rd
- 138 Antwerp Ave
- 217 Mound St
- 126 Church St
- 7005 Westbrook Rd
- 208 N Wolf Creek St
- 10427 Upper Lewisburg Salem Rd
- 530 E Westbrook Rd
- 12 Harshman St
- 137 Evergreen Way
- 114 Evergreen Way
- 766 Hunters Run Dr
- 4 E Mckinley St
- 421 Market St
- 567 Golden Maple Ave
- 214 Hay Ave
- 107 Autumn Maple Ln
- 152 Autumn Maple Ln
- 115 Ostend St