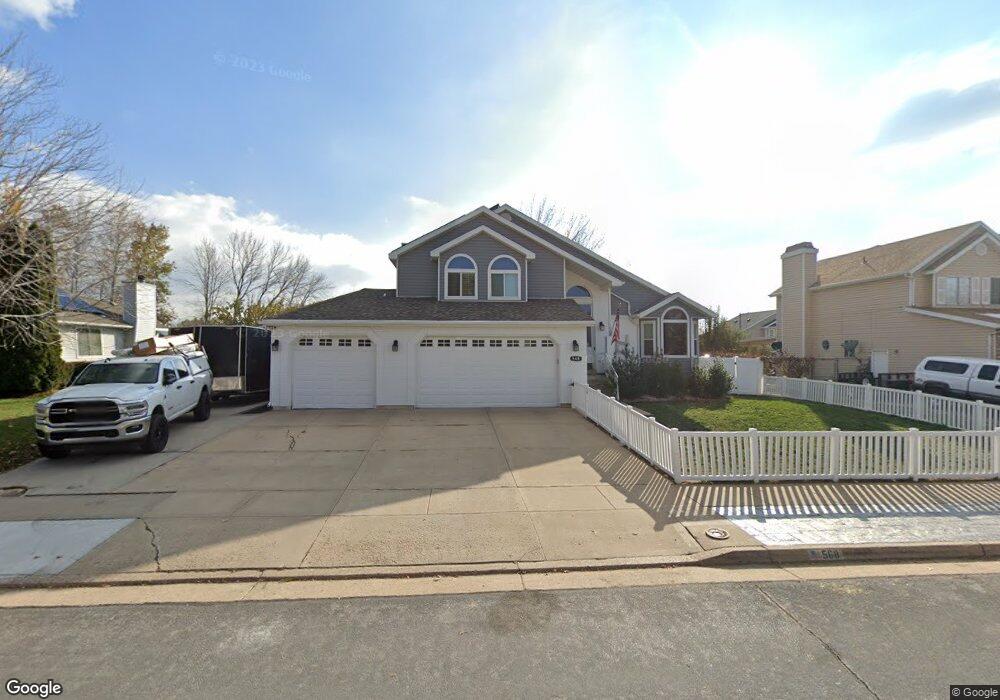
568 E 1200 S Kaysville, UT 84037
Estimated Value: $600,000 - $702,000
5
Beds
4
Baths
2,904
Sq Ft
$227/Sq Ft
Est. Value
About This Home
This home is located at 568 E 1200 S, Kaysville, UT 84037 and is currently estimated at $659,883, approximately $227 per square foot. 568 E 1200 S is a home located in Davis County with nearby schools including Windridge Elementary School, Kaysville Junior High School, and Davis High School.
Ownership History
Date
Name
Owned For
Owner Type
Purchase Details
Closed on
Jul 25, 2024
Sold by
Jensen Family Revocable Living Trust and Jensen Troy
Bought by
Fryar Bracken David and Fryar Melissa Marie
Current Estimated Value
Home Financials for this Owner
Home Financials are based on the most recent Mortgage that was taken out on this home.
Original Mortgage
$594,000
Outstanding Balance
$586,318
Interest Rate
6.95%
Mortgage Type
New Conventional
Estimated Equity
$73,565
Purchase Details
Closed on
Nov 4, 2022
Sold by
Jensen Troy and Jensen Mandy
Bought by
Jensen Family Revocable Living Trust
Purchase Details
Closed on
Nov 28, 2012
Sold by
Horsley Scott A and Horsley Tracy D
Bought by
Jensen Troy and Jensen Mandy
Home Financials for this Owner
Home Financials are based on the most recent Mortgage that was taken out on this home.
Original Mortgage
$265,600
Interest Rate
3.25%
Mortgage Type
FHA
Create a Home Valuation Report for This Property
The Home Valuation Report is an in-depth analysis detailing your home's value as well as a comparison with similar homes in the area
Home Values in the Area
Average Home Value in this Area
Purchase History
| Date | Buyer | Sale Price | Title Company |
|---|---|---|---|
| Fryar Bracken David | -- | Hickman Land Title | |
| Jensen Family Revocable Living Trust | -- | -- | |
| Jensen Family Revocable Living Trust | -- | None Listed On Document | |
| Jensen Troy | -- | Hickman Land Title |
Source: Public Records
Mortgage History
| Date | Status | Borrower | Loan Amount |
|---|---|---|---|
| Open | Fryar Bracken David | $594,000 | |
| Previous Owner | Jensen Troy | $265,600 |
Source: Public Records
Tax History Compared to Growth
Tax History
| Year | Tax Paid | Tax Assessment Tax Assessment Total Assessment is a certain percentage of the fair market value that is determined by local assessors to be the total taxable value of land and additions on the property. | Land | Improvement |
|---|---|---|---|---|
| 2025 | $3,123 | $355,300 | $158,670 | $196,630 |
| 2024 | $3,123 | $319,550 | $160,557 | $158,993 |
| 2023 | $3,081 | $558,000 | $279,834 | $278,166 |
| 2022 | $3,109 | $318,450 | $132,448 | $186,002 |
| 2021 | $2,864 | $439,000 | $183,733 | $255,267 |
| 2020 | $2,591 | $386,000 | $132,113 | $253,887 |
| 2019 | $2,509 | $367,000 | $108,428 | $258,572 |
| 2018 | $2,315 | $337,000 | $98,571 | $238,429 |
| 2016 | $2,074 | $158,070 | $33,322 | $124,748 |
| 2015 | $1,993 | $144,265 | $33,322 | $110,943 |
| 2014 | $2,059 | $151,683 | $33,322 | $118,361 |
| 2013 | -- | $126,301 | $32,788 | $93,513 |
Source: Public Records
Map
Nearby Homes
- 548 E 1250 S
- 1424 S 400 E
- 830 E 1250 S
- 557 E Warm Springs Dr
- 1472 Via la Costa Way
- 1315 S 175 E
- 245 E 1400 S
- 960 E Par Three Cir
- 1789 Stayner Dr
- 1310 S 125 E
- 1372 Sweetwater Ln
- 617 E Whisper Creek Dr
- 1175 W 1875 N
- 1746 S 300 E
- 1406 Swinton Ln
- 1043 S Oxford Cir
- 673 S Main St
- 947 S Honeysuckle Way
- 481 E Laurelwood Dr S
- 118 E 600 S