Estimated Value: $230,064 - $262,000
3
Beds
2
Baths
1,837
Sq Ft
$135/Sq Ft
Est. Value
About This Home
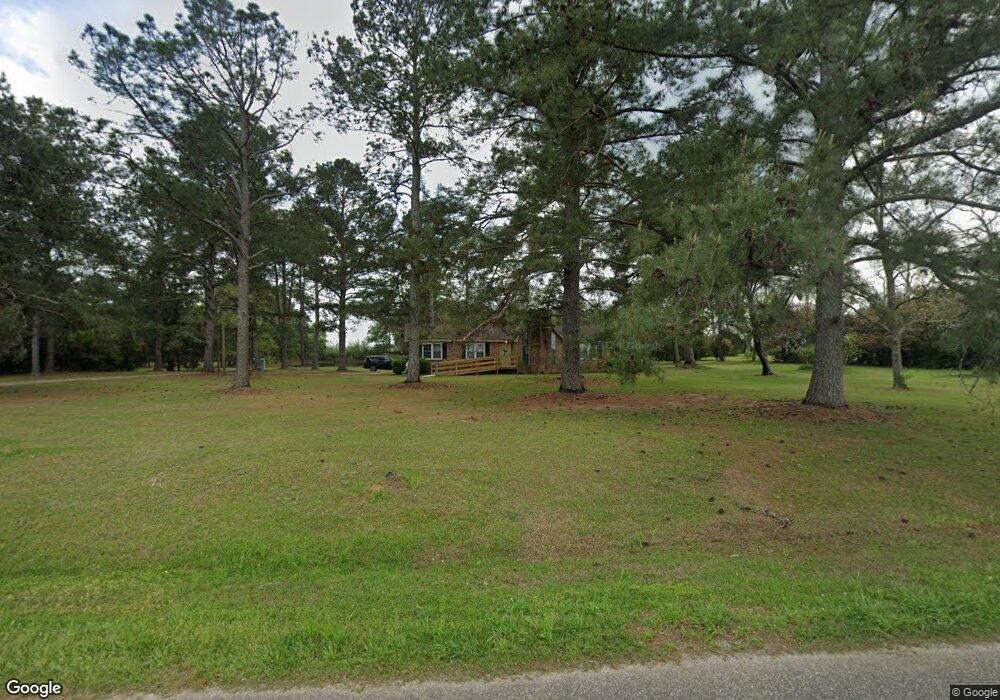
This home is located at 568 Elkins Rd, Cairo, GA 39827 and is currently estimated at $248,516, approximately $135 per square foot. 568 Elkins Rd is a home located in Grady County with nearby schools including Raev Academy.
Ownership History
Date
Name
Owned For
Owner Type
Purchase Details
Closed on
May 25, 2006
Sold by
English Rhonda B
Bought by
English Rhonda B and English Allen
Current Estimated Value
Purchase Details
Closed on
Aug 15, 2001
Sold by
Smith Marcus
Bought by
English Rhonda B
Purchase Details
Closed on
Jan 13, 1978
Bought by
Smith Marcus
Create a Home Valuation Report for This Property
The Home Valuation Report is an in-depth analysis detailing your home's value as well as a comparison with similar homes in the area
Home Values in the Area
Average Home Value in this Area
Purchase History
| Date | Buyer | Sale Price | Title Company |
|---|---|---|---|
| English Rhonda B | -- | -- | |
| English Rhonda B | $104,800 | -- | |
| Smith Marcus | -- | -- |
Source: Public Records
Tax History Compared to Growth
Tax History
| Year | Tax Paid | Tax Assessment Tax Assessment Total Assessment is a certain percentage of the fair market value that is determined by local assessors to be the total taxable value of land and additions on the property. | Land | Improvement |
|---|---|---|---|---|
| 2024 | $2,257 | $75,368 | $5,758 | $69,610 |
| 2023 | $1,448 | $49,041 | $3,707 | $45,334 |
| 2022 | $1,448 | $49,041 | $3,707 | $45,334 |
| 2021 | $1,459 | $49,241 | $3,707 | $45,534 |
| 2020 | $1,464 | $49,241 | $3,707 | $45,534 |
| 2019 | $1,464 | $49,241 | $3,707 | $45,534 |
| 2018 | $1,374 | $49,241 | $3,707 | $45,534 |
| 2017 | $1,308 | $49,241 | $3,707 | $45,534 |
| 2016 | $1,120 | $42,194 | $3,707 | $38,487 |
| 2015 | $1,106 | $42,194 | $3,707 | $38,487 |
| 2014 | $1,107 | $42,194 | $3,707 | $38,487 |
| 2013 | -- | $39,564 | $5,130 | $34,434 |
Source: Public Records
Map
Nearby Homes
- 1016 Richter Rd
- 1210 Elkins Rd
- 3136 State Route 188
- 414 Woodland Rd
- 105 Woodridge Ln
- 158 Woodridge Ln
- 2427 Pierce Chapel Rd
- 00 State Route 188
- 0 State Route 188
- 264 Woodridge Ln
- 963 Pope's Store Rd
- 126 Banks Rd
- 0 NE Airport Rd Unit 145784
- 000 15th Ave Nw -- Tract 2
- 000 15th Ave Nw -- Tract 1
- 1420 Parallel Dr NW
- 1725 Tract 2 Hwy 84w
- 1725 Tract #1 Hwy 84w
- 00 NW 9th Ave
- 1490 Magnolia Dr