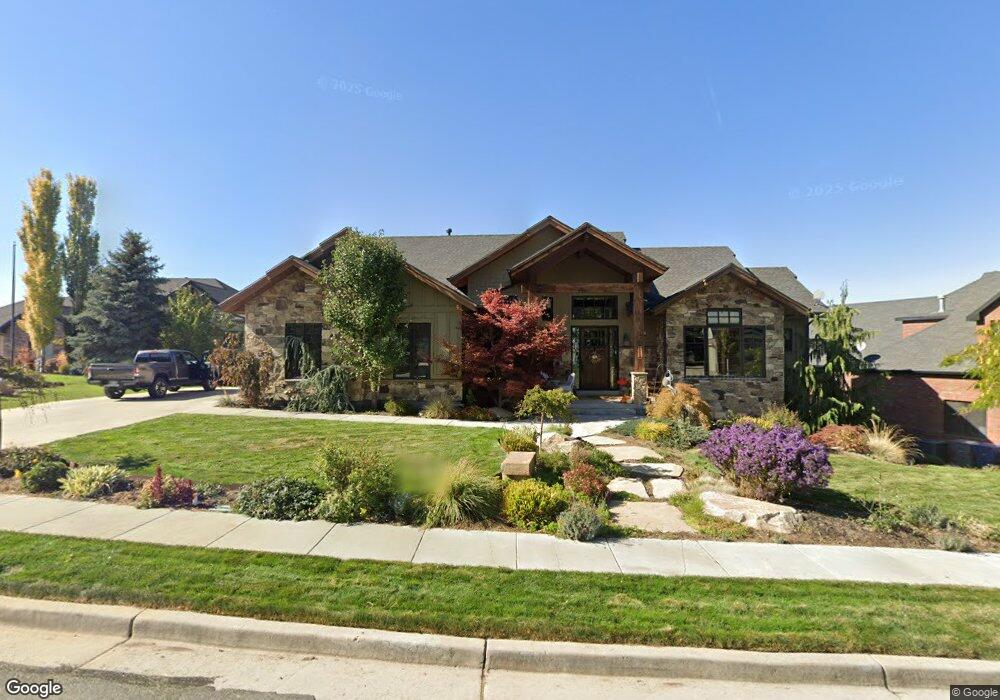
568 Hidden Cir North Salt Lake, UT 84054
Estimated Value: $1,138,000 - $1,403,205
4
Beds
4
Baths
2,380
Sq Ft
$521/Sq Ft
Est. Value
About This Home
This home is located at 568 Hidden Cir, North Salt Lake, UT 84054 and is currently estimated at $1,240,051, approximately $521 per square foot. 568 Hidden Cir is a home located in Davis County with nearby schools including Orchard School, South Davis Junior High School, and Woods Cross High School.
Ownership History
Date
Name
Owned For
Owner Type
Purchase Details
Closed on
Feb 11, 2011
Sold by
Saeva Samuel Joseph and Saeva Robin R
Bought by
Saeva Samuel J and Saeva Robin Russell
Current Estimated Value
Home Financials for this Owner
Home Financials are based on the most recent Mortgage that was taken out on this home.
Original Mortgage
$417,000
Outstanding Balance
$292,886
Interest Rate
4.87%
Mortgage Type
Construction
Estimated Equity
$947,165
Purchase Details
Closed on
Aug 5, 2008
Sold by
Saeva Robin R
Bought by
Saeva Samuel Joseph and Saeva Robin R
Purchase Details
Closed on
Feb 22, 2005
Sold by
Saeva Samuel Joseph and Saeva Robin R
Bought by
Saeva Robin R
Purchase Details
Closed on
Sep 19, 2000
Sold by
Eaglepointe Development Lc
Bought by
Saeva Samuel Joseph and Saeva Robin R
Create a Home Valuation Report for This Property
The Home Valuation Report is an in-depth analysis detailing your home's value as well as a comparison with similar homes in the area
Home Values in the Area
Average Home Value in this Area
Purchase History
| Date | Buyer | Sale Price | Title Company |
|---|---|---|---|
| Saeva Samuel J | -- | Cornerstone Title Ins Agency | |
| Saeva Samuel Joseph | -- | None Available | |
| Saeva Robin R | -- | Security Title | |
| Saeva Samuel Joseph | -- | Associated Title Company |
Source: Public Records
Mortgage History
| Date | Status | Borrower | Loan Amount |
|---|---|---|---|
| Open | Saeva Samuel J | $417,000 |
Source: Public Records
Tax History Compared to Growth
Tax History
| Year | Tax Paid | Tax Assessment Tax Assessment Total Assessment is a certain percentage of the fair market value that is determined by local assessors to be the total taxable value of land and additions on the property. | Land | Improvement |
|---|---|---|---|---|
| 2025 | $8,079 | $799,150 | $187,300 | $611,850 |
| 2024 | $7,687 | $773,301 | $195,443 | $577,858 |
| 2023 | $7,215 | $1,312,000 | $255,551 | $1,056,449 |
| 2022 | $6,578 | $656,700 | $141,570 | $515,130 |
| 2021 | $5,822 | $882,000 | $210,138 | $671,862 |
| 2020 | $5,446 | $816,000 | $182,935 | $633,065 |
| 2019 | $5,549 | $811,000 | $176,714 | $634,286 |
| 2018 | $5,092 | $736,000 | $158,894 | $577,106 |
| 2016 | $4,634 | $356,180 | $83,116 | $273,064 |
| 2015 | $4,379 | $323,400 | $83,116 | $240,284 |
| 2014 | $4,743 | $308,000 | $83,116 | $224,884 |
| 2013 | -- | $308,000 | $101,149 | $206,851 |
Source: Public Records
Map
Nearby Homes
- 311 Edgemont Dr
- 755 Parkway Dr
- 690 Freedom Dr
- 460 S Sunset Ridge Dr
- 789 Miller Ave
- 715 S Miller Ave
- 520 Lacey Way
- 919 Parkway Dr
- 151 S Bernice Way
- 871 S Winter Ln
- 585 Marialana Way
- 837 S Finley Cir
- 951 S Winter Ln Unit 209
- 683 Hillside Oak Cir
- 72 S 130 E
- 2420 S Orchard Dr
- 90 Scenic Hills Cir
- 244 Odell Lane 100 N
- 178 N Valley View Dr
- 638 Scenic Hills Dr
- 552 Hidden Cir
- 580 Hidden Cir
- 571 Hidden Cir
- 555 Lofty Ln
- 559 Hidden Cir
- 534 Hidden Cir
- 583 Hidden Cir
- 567 Lofty Ln
- 543 Lofty Ln
- 592 Hidden Cir
- 547 Hidden Cir
- 593 Hidden Cir
- 585 Lofty Ln
- 594 S Ridge Top Ln E
- 518 Hidden Cir
- 580 Ridge Top Ln
- 531 Lofty Ln
- 594 Ridge Top Ln
- 531 Hidden Cir
- 606 Ridge Top Ln