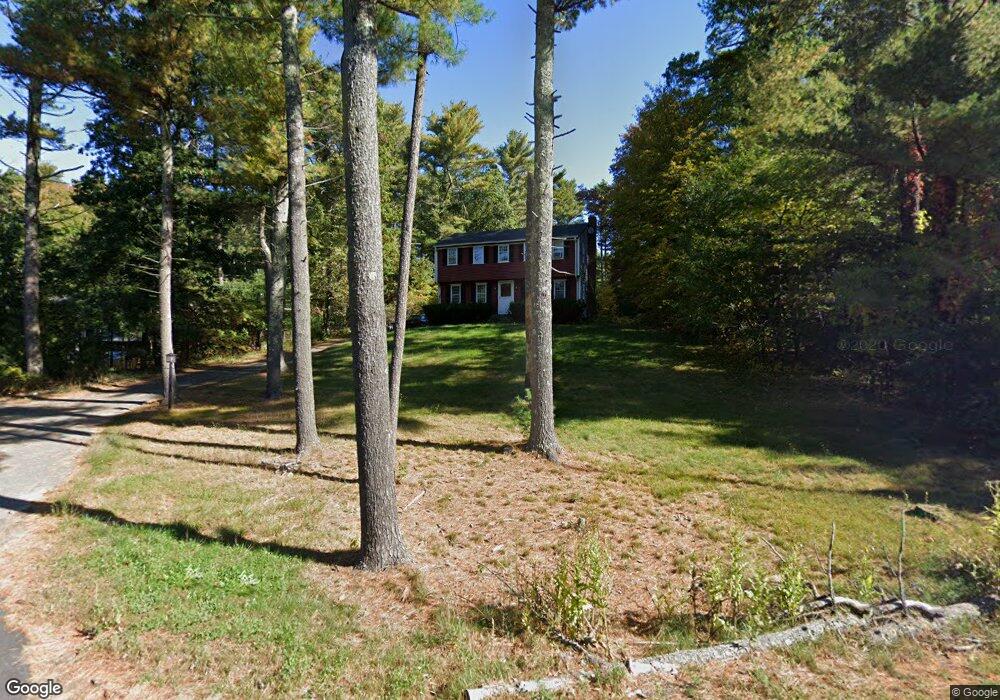
568 Main St Marshfield, MA 02050
Estimated Value: $758,675 - $872,000
4
Beds
2
Baths
1,700
Sq Ft
$480/Sq Ft
Est. Value
About This Home
This home is located at 568 Main St, Marshfield, MA 02050 and is currently estimated at $816,169, approximately $480 per square foot. 568 Main St is a home located in Plymouth County with nearby schools including Martinson Elementary School, Furnace Brook Middle School, and Marshfield High School.
Ownership History
Date
Name
Owned For
Owner Type
Purchase Details
Closed on
Feb 24, 2022
Sold by
Treu Susanne E
Bought by
Treu Lonnie D
Current Estimated Value
Purchase Details
Closed on
Jul 30, 1992
Sold by
Cadigan Brian J and Cadigan Kathleen
Bought by
Treu Lonnie D and Treu Susanne E
Create a Home Valuation Report for This Property
The Home Valuation Report is an in-depth analysis detailing your home's value as well as a comparison with similar homes in the area
Home Values in the Area
Average Home Value in this Area
Purchase History
| Date | Buyer | Sale Price | Title Company |
|---|---|---|---|
| Treu Lonnie D | -- | None Available | |
| Treu Lonnie D | $157,000 | -- |
Source: Public Records
Mortgage History
| Date | Status | Borrower | Loan Amount |
|---|---|---|---|
| Previous Owner | Treu Lonnie D | $285,000 | |
| Previous Owner | Treu Lonnie D | $250,000 | |
| Previous Owner | Treu Lonnie D | $200,000 |
Source: Public Records
Tax History
| Year | Tax Paid | Tax Assessment Tax Assessment Total Assessment is a certain percentage of the fair market value that is determined by local assessors to be the total taxable value of land and additions on the property. | Land | Improvement |
|---|---|---|---|---|
| 2025 | $6,395 | $646,000 | $320,200 | $325,800 |
| 2024 | $6,260 | $602,500 | $304,900 | $297,600 |
| 2023 | $5,800 | $542,000 | $283,100 | $258,900 |
| 2022 | $5,800 | $447,900 | $228,700 | $219,200 |
| 2021 | $5,575 | $422,700 | $226,500 | $196,200 |
| 2020 | $5,296 | $397,300 | $206,900 | $190,400 |
| 2019 | $5,162 | $385,800 | $206,900 | $178,900 |
| 2018 | $5,107 | $382,000 | $206,900 | $175,100 |
| 2017 | $4,864 | $354,500 | $196,000 | $158,500 |
| 2016 | $4,610 | $332,100 | $185,100 | $147,000 |
| 2015 | $4,362 | $328,200 | $185,100 | $143,100 |
| 2014 | $4,095 | $308,100 | $169,900 | $138,200 |
Source: Public Records
Map
Nearby Homes
- 341 Furnace St
- 14 Ferry St
- 235 Main St
- 2 Proprietors Dr Unit 25
- 2 Proprietors Dr Unit 26
- 2 Proprietors Dr Unit 27
- 889 Old Main Street Extension
- 167 Planting Field Rd
- 3 Red Pony Path Unit 3
- 60 Samuel Curtis Way
- 1155 Main St
- 848 Plain St Unit 41
- 848 Plain St Unit 23
- 451 School St Unit 2-5
- 451 School St Unit 5-2
- 39 High Beacon Way
- 10 Spyglass Landing Dr
- 29 Spyglass Landing Dr
- 290 S River St
- 16 Schooner Way
Your Personal Tour Guide
Ask me questions while you tour the home.