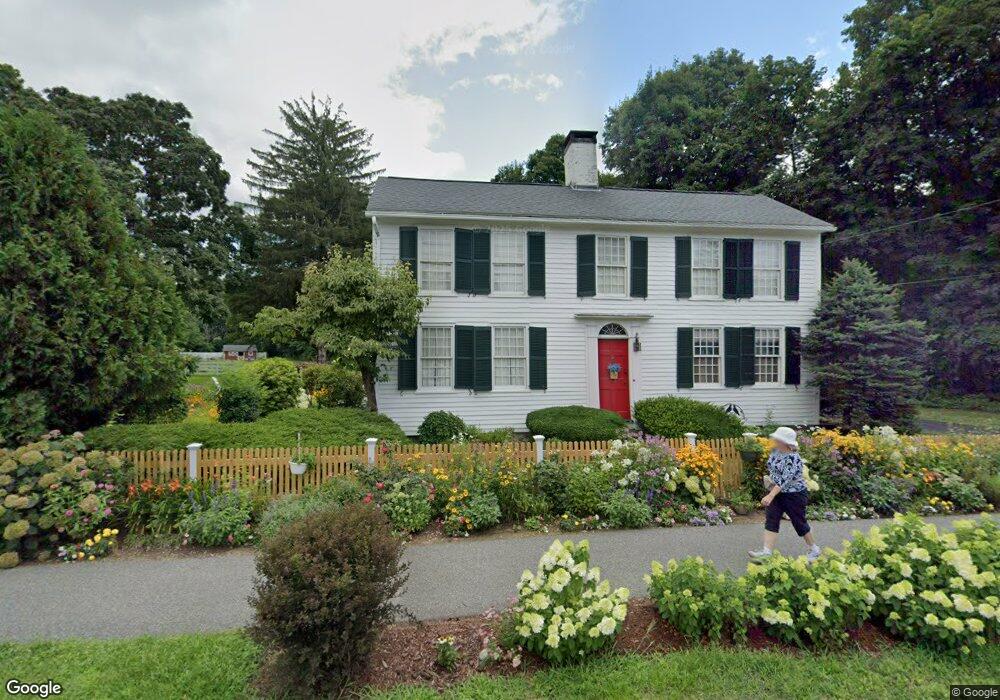
568 Main St Wilbraham, MA 01095
Estimated Value: $477,000 - $579,000
3
Beds
2
Baths
2,097
Sq Ft
$252/Sq Ft
Est. Value
About This Home
This home is located at 568 Main St, Wilbraham, MA 01095 and is currently estimated at $528,172, approximately $251 per square foot. 568 Main St is a home located in Hampden County with nearby schools including Minnechaug Regional High School, Springfield International Charter School, and Wilbraham & Monson Academy.
Ownership History
Date
Name
Owned For
Owner Type
Purchase Details
Closed on
Nov 14, 1996
Sold by
Harrington Cornelius D and Harrington Helen A
Bought by
Mccarthy D John and Mccarthy Mary E
Current Estimated Value
Create a Home Valuation Report for This Property
The Home Valuation Report is an in-depth analysis detailing your home's value as well as a comparison with similar homes in the area
Home Values in the Area
Average Home Value in this Area
Purchase History
| Date | Buyer | Sale Price | Title Company |
|---|---|---|---|
| Mccarthy D John | $239,000 | -- |
Source: Public Records
Mortgage History
| Date | Status | Borrower | Loan Amount |
|---|---|---|---|
| Open | Mccarthy D John | $55,000 | |
| Closed | Mccarthy D John | $16,000 | |
| Closed | Mccarthy D John | $20,000 |
Source: Public Records
Tax History Compared to Growth
Tax History
| Year | Tax Paid | Tax Assessment Tax Assessment Total Assessment is a certain percentage of the fair market value that is determined by local assessors to be the total taxable value of land and additions on the property. | Land | Improvement |
|---|---|---|---|---|
| 2025 | $8,234 | $460,500 | $127,100 | $333,400 |
| 2024 | $8,214 | $444,000 | $127,100 | $316,900 |
| 2023 | $7,481 | $414,500 | $127,100 | $287,400 |
| 2022 | $7,481 | $365,100 | $127,100 | $238,000 |
| 2021 | $6,725 | $292,900 | $109,900 | $183,000 |
| 2020 | $6,555 | $292,900 | $109,900 | $183,000 |
| 2019 | $6,387 | $293,000 | $109,900 | $183,100 |
| 2018 | $6,398 | $282,600 | $109,900 | $172,700 |
| 2017 | $6,217 | $282,600 | $109,900 | $172,700 |
| 2016 | $6,119 | $283,300 | $120,400 | $162,900 |
| 2015 | $5,915 | $283,300 | $120,400 | $162,900 |
Source: Public Records
Map
Nearby Homes
- 68 Monson Rd
- 6 Hilltop Park
- 8 Patriot Ridge Ln
- 1028 Tinkham Rd
- 12 Highridge Rd
- 2 Bayberry Dr Unit 51
- 751 Ridge Rd
- 6 Katie St
- 760 Stony Hill Rd
- 767 Stony Hill Rd
- 763 Stony Hill Rd
- 17 Peak Rd
- 14 Brookdale Dr
- 474 Mountain Rd
- 28 Decorie Dr
- 5 Edgewood Rd
- 407 Monson Rd
- 230V Burleigh Rd
- 474-480 Mountain Rd
- 5 Old Carriage Dr