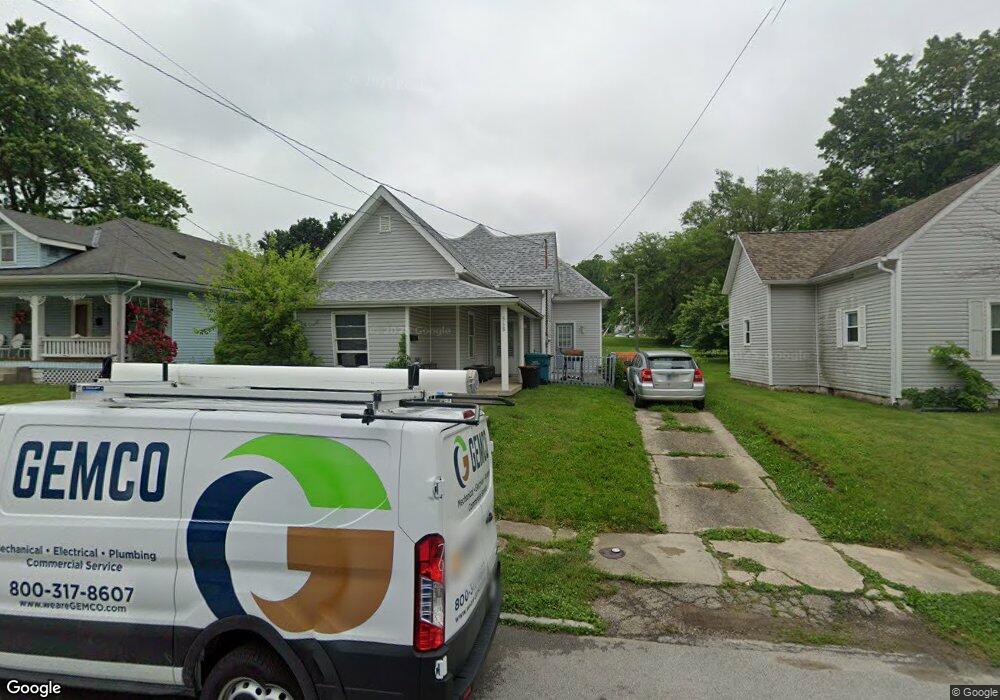
568 N 12th St New Castle, IN 47362
Estimated Value: $113,915 - $136,000
3
Beds
1
Bath
1,641
Sq Ft
$75/Sq Ft
Est. Value
About This Home
This home is located at 568 N 12th St, New Castle, IN 47362 and is currently estimated at $123,229, approximately $75 per square foot. 568 N 12th St is a home located in Henry County with nearby schools including Agape Learning Center.
Ownership History
Date
Name
Owned For
Owner Type
Purchase Details
Closed on
Jun 30, 2017
Sold by
Lainhart David and Lainhart Jessie
Bought by
Mahoney Phillip and Mahoney Sharon
Current Estimated Value
Purchase Details
Closed on
Mar 27, 2010
Sold by
Mahoney Phillip and Mahoney Sharon
Bought by
Lainhart David and Lainhart Jessie
Purchase Details
Closed on
Oct 18, 2004
Sold by
Mahoney Phillip and Mahoney Sharon
Bought by
Gard Brett and Gard Donna
Create a Home Valuation Report for This Property
The Home Valuation Report is an in-depth analysis detailing your home's value as well as a comparison with similar homes in the area
Home Values in the Area
Average Home Value in this Area
Purchase History
| Date | Buyer | Sale Price | Title Company |
|---|---|---|---|
| Mahoney Phillip | -- | None Available | |
| Lainhart David | $59,900 | None Available | |
| Gard Brett | $75,950 | None Available |
Source: Public Records
Mortgage History
| Date | Status | Borrower | Loan Amount |
|---|---|---|---|
| Closed | Gard Brett | $0 |
Source: Public Records
Tax History Compared to Growth
Tax History
| Year | Tax Paid | Tax Assessment Tax Assessment Total Assessment is a certain percentage of the fair market value that is determined by local assessors to be the total taxable value of land and additions on the property. | Land | Improvement |
|---|---|---|---|---|
| 2024 | $1,160 | $58,000 | $14,100 | $43,900 |
| 2023 | $1,070 | $53,500 | $14,100 | $39,400 |
| 2022 | $806 | $40,300 | $9,400 | $30,900 |
| 2021 | $748 | $37,400 | $9,400 | $28,000 |
| 2020 | $776 | $37,400 | $9,400 | $28,000 |
| 2019 | $764 | $36,800 | $9,400 | $27,400 |
| 2018 | $384 | $36,300 | $9,400 | $26,900 |
| 2017 | $357 | $35,900 | $9,400 | $26,500 |
| 2016 | $373 | $37,800 | $9,900 | $27,900 |
| 2014 | $275 | $30,900 | $9,900 | $21,000 |
| 2013 | $275 | $29,900 | $9,900 | $20,000 |
Source: Public Records
Map
Nearby Homes
- 595 N Main St
- 711 N 14th St
- 1321 Woodward Ave
- 1293 Garner St
- 1522 Michigan St
- 1324 Thornburg St
- Enslow Plan at The Preserve at Northfield Village
- Buchanan Plan at The Preserve at Northfield Village
- Mckinley Plan at The Preserve at Northfield Village
- Eisenhower Plan at The Preserve at Northfield Village
- Cleveland Plan at The Preserve at Northfield Village
- Windsor Plan at The Preserve at Northfield Village
- Wellingston Plan at The Preserve at Northfield Village
- Sunderland Plan at The Preserve at Northfield Village
- Stirling Plan at The Preserve at Northfield Village
- Preston Plan at The Preserve at Northfield Village
- Oxford Plan at The Preserve at Northfield Village
- Newport Plan at The Preserve at Northfield Village
- Kingston Plan at The Preserve at Northfield Village
- Kent Plan at The Preserve at Northfield Village