Estimated Value: $118,000 - $198,000
3
Beds
1
Bath
1,152
Sq Ft
$138/Sq Ft
Est. Value
About This Home
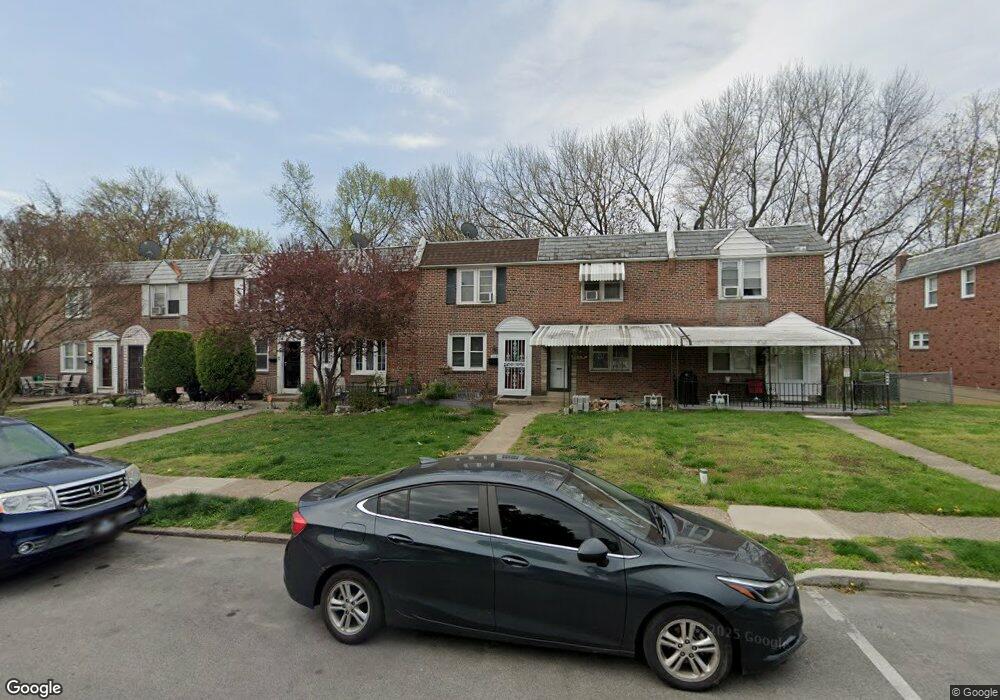
This home is located at 568 S 4th St, Darby, PA 19023 and is currently estimated at $158,585, approximately $137 per square foot. 568 S 4th St is a home located in Delaware County with nearby schools including Colwyn Elementary School, Penn Wood Middle School, and Penn Wood High School - Cypress Street Campus.
Ownership History
Date
Name
Owned For
Owner Type
Purchase Details
Closed on
Dec 8, 2006
Sold by
Darpolor Marie S
Bought by
Darpolor Marie S and Darpolor Aloysius W
Current Estimated Value
Purchase Details
Closed on
Apr 28, 2006
Sold by
Singletary Quinn A
Bought by
Darpolor Marie S
Home Financials for this Owner
Home Financials are based on the most recent Mortgage that was taken out on this home.
Original Mortgage
$87,300
Outstanding Balance
$50,387
Interest Rate
6.34%
Mortgage Type
Purchase Money Mortgage
Estimated Equity
$108,198
Purchase Details
Closed on
Apr 27, 2000
Sold by
Benditt Harry F and Benditt Helen C
Bought by
Singletary Quinn A
Home Financials for this Owner
Home Financials are based on the most recent Mortgage that was taken out on this home.
Original Mortgage
$50,358
Interest Rate
8.21%
Mortgage Type
FHA
Create a Home Valuation Report for This Property
The Home Valuation Report is an in-depth analysis detailing your home's value as well as a comparison with similar homes in the area
Home Values in the Area
Average Home Value in this Area
Purchase History
| Date | Buyer | Sale Price | Title Company |
|---|---|---|---|
| Darpolor Marie S | -- | None Available | |
| Darpolor Marie S | $90,000 | None Available | |
| Singletary Quinn A | $49,900 | -- |
Source: Public Records
Mortgage History
| Date | Status | Borrower | Loan Amount |
|---|---|---|---|
| Open | Darpolor Marie S | $87,300 | |
| Previous Owner | Singletary Quinn A | $50,358 |
Source: Public Records
Tax History Compared to Growth
Tax History
| Year | Tax Paid | Tax Assessment Tax Assessment Total Assessment is a certain percentage of the fair market value that is determined by local assessors to be the total taxable value of land and additions on the property. | Land | Improvement |
|---|---|---|---|---|
| 2025 | $2,886 | $55,430 | $12,600 | $42,830 |
| 2024 | $2,886 | $55,430 | $12,600 | $42,830 |
| 2023 | $1,771 | $55,430 | $12,600 | $42,830 |
| 2022 | $2,737 | $55,430 | $12,600 | $42,830 |
| 2021 | $3,786 | $55,430 | $12,600 | $42,830 |
| 2020 | $3,867 | $49,730 | $17,420 | $32,310 |
| 2019 | $3,812 | $49,730 | $17,420 | $32,310 |
| 2018 | $3,770 | $49,730 | $0 | $0 |
| 2017 | $3,707 | $49,730 | $0 | $0 |
| 2016 | $273 | $49,730 | $0 | $0 |
| 2015 | $273 | $49,730 | $0 | $0 |
| 2014 | $273 | $49,730 | $0 | $0 |
Source: Public Records
Map
Nearby Homes