R
Landlord's Agent in 2019
Robin Chew
Northview Realty, LLC.
(404) 509-3684
6 in this area
25 Total Sales
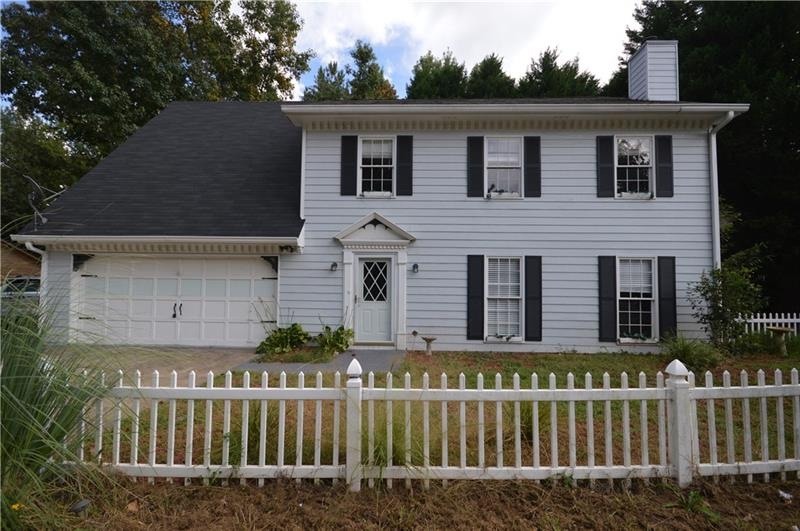
Estimated Value: $366,000 - $424,000
Desirable location, just steps away from shopping center. Spacious Updated Kitchen, Updated Master bedroom, 4 Spacious Bedrooms, Tile Flooring throughout main floor. New paint, New Carpet. Natural Light through out the house. Great fenced in backyard Fenced.
Last Agent to Rent the Property
Northview Realty, LLC. License #255342 Listed on: 10/03/2019
| Date | Buyer | Sale Price | Title Company |
|---|---|---|---|
| Ru Chaxiang | $170,000 | -- | |
| Furry Carolyn A | $140,000 | -- |
| Date | Status | Borrower | Loan Amount |
|---|---|---|---|
| Previous Owner | Furry Carolyn A | $112,000 |
| Date | Event | Price | List to Sale | Price per Sq Ft | Prior Sale |
|---|---|---|---|---|---|
| 10/30/2019 10/30/19 | Rented | $1,495 | 0.0% | -- | |
| 10/19/2019 10/19/19 | Under Contract | -- | -- | -- | |
| 10/03/2019 10/03/19 | For Rent | $1,495 | +3.1% | -- | |
| 09/29/2018 09/29/18 | Rented | $1,450 | -3.0% | -- | |
| 09/07/2018 09/07/18 | For Rent | $1,495 | 0.0% | -- | |
| 01/05/2017 01/05/17 | Sold | $170,000 | -8.1% | $86 / Sq Ft | View Prior Sale |
| 12/02/2016 12/02/16 | Pending | -- | -- | -- | |
| 11/23/2016 11/23/16 | For Sale | $185,000 | +32.1% | $93 / Sq Ft | |
| 01/14/2015 01/14/15 | Sold | $140,000 | -3.4% | $71 / Sq Ft | View Prior Sale |
| 12/15/2014 12/15/14 | Pending | -- | -- | -- | |
| 09/19/2014 09/19/14 | For Sale | $145,000 | -- | $73 / Sq Ft |
| Year | Tax Paid | Tax Assessment Tax Assessment Total Assessment is a certain percentage of the fair market value that is determined by local assessors to be the total taxable value of land and additions on the property. | Land | Improvement |
|---|---|---|---|---|
| 2025 | -- | $105,160 | $24,000 | $81,160 |
| 2024 | -- | $105,160 | $24,000 | $81,160 |
| 2023 | $4,055 | $105,160 | $24,000 | $81,160 |
| 2022 | $0 | $89,120 | $12,000 | $77,120 |
| 2021 | $2,340 | $59,200 | $29,280 | $29,920 |
| 2020 | $2,340 | $59,200 | $29,280 | $29,920 |
| 2019 | $2,340 | $59,200 | $29,280 | $29,920 |
| 2018 | $2,225 | $56,000 | $18,280 | $37,720 |
| 2016 | $2,243 | $56,000 | $18,280 | $37,720 |
| 2015 | $938 | $60,360 | $18,280 | $42,080 |
| 2014 | $946 | $60,360 | $18,280 | $42,080 |
R
Landlord's Agent in 2019
Robin Chew
Northview Realty, LLC.
(404) 509-3684
6 in this area
25 Total Sales

Seller's Agent in 2017
COMMON GROUND REAL ESTATE
Coldwell Banker Realty
(678) 408-2473
19 in this area
150 Total Sales
S
Seller Co-Listing Agent in 2017
Shannon Hames
NOT A VALID MEMBER
O
Buyer's Agent in 2017
Olivia Lu
NOT A VALID MEMBER
Seller's Agent in 2015
Todd Lemoine
Keller Williams Realty Partners
(770) 652-7306
12 in this area
66 Total Sales
Buyer's Agent in 2015
Denise Hardin
Virtual Properties Realty.com
(404) 358-3645
4 in this area
20 Total Sales
Source: First Multiple Listing Service (FMLS)
MLS Number: 6626966
APN: 7-110-443
Disclaimer: Certain information contained herein is derived from information provided by parties other than Homes.com. All information provided is deemed reliable, but is not guaranteed to be accurate and should be independently verified.
![]() Listings identified with the FMLS IDX logo come from FMLS and are held by brokerage firms other than the owner of this website. The listing brokerage is identified in any listing details. Information is deemed reliable but is not guaranteed. If you believe any FMLS listing contains material that infringes your copyrighted work please visit www.fmls.com/dmca to review our DMCA policy and learn how to submit a takedown request. © 2025 First Multiple Listing Service, Inc.
Listings identified with the FMLS IDX logo come from FMLS and are held by brokerage firms other than the owner of this website. The listing brokerage is identified in any listing details. Information is deemed reliable but is not guaranteed. If you believe any FMLS listing contains material that infringes your copyrighted work please visit www.fmls.com/dmca to review our DMCA policy and learn how to submit a takedown request. © 2025 First Multiple Listing Service, Inc.