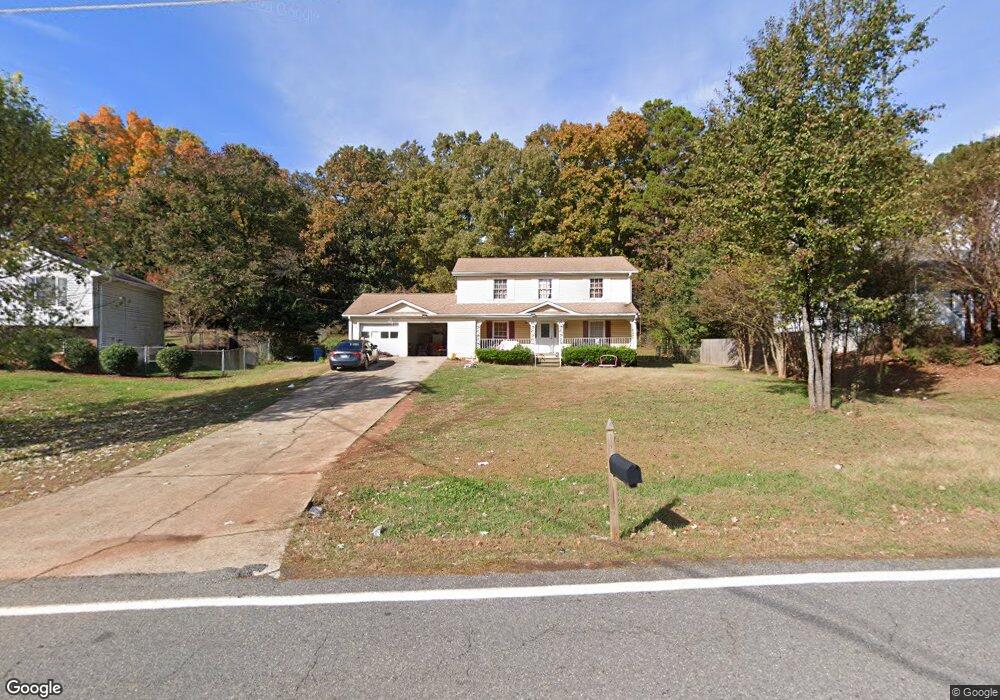
568 Tidwell Rd Unit 3 Alpharetta, GA 30004
Estimated Value: $404,000 - $435,000
4
Beds
3
Baths
1,772
Sq Ft
$234/Sq Ft
Est. Value
About This Home
This home is located at 568 Tidwell Rd Unit 3, Alpharetta, GA 30004 and is currently estimated at $414,646, approximately $233 per square foot. 568 Tidwell Rd Unit 3 is a home located in Forsyth County with nearby schools including Brandywine Elementary School, DeSana Middle School, and Denmark High School.
Ownership History
Date
Name
Owned For
Owner Type
Purchase Details
Closed on
Jun 3, 2022
Sold by
Patel Ramesh M
Bought by
Patel Nayan K and Patel Sapana N
Current Estimated Value
Purchase Details
Closed on
Sep 22, 2005
Sold by
Pebbles Casey R and Pebbles Kristen
Bought by
Patel Nayan K and Patel Sapna
Home Financials for this Owner
Home Financials are based on the most recent Mortgage that was taken out on this home.
Original Mortgage
$149,150
Interest Rate
6.96%
Mortgage Type
New Conventional
Purchase Details
Closed on
Apr 18, 2003
Sold by
Hagy Ancil G and Hagy Crystal
Bought by
Peebles Casey R and Peebles Kristen
Home Financials for this Owner
Home Financials are based on the most recent Mortgage that was taken out on this home.
Original Mortgage
$150,900
Interest Rate
5.6%
Mortgage Type
FHA
Create a Home Valuation Report for This Property
The Home Valuation Report is an in-depth analysis detailing your home's value as well as a comparison with similar homes in the area
Home Values in the Area
Average Home Value in this Area
Purchase History
| Date | Buyer | Sale Price | Title Company |
|---|---|---|---|
| Patel Nayan K | -- | Prabhu Nikhil R | |
| Patel Nayan K | $157,000 | -- | |
| Peebles Casey R | $153,400 | -- |
Source: Public Records
Mortgage History
| Date | Status | Borrower | Loan Amount |
|---|---|---|---|
| Previous Owner | Patel Nayan K | $149,150 | |
| Previous Owner | Peebles Casey R | $150,900 |
Source: Public Records
Tax History Compared to Growth
Tax History
| Year | Tax Paid | Tax Assessment Tax Assessment Total Assessment is a certain percentage of the fair market value that is determined by local assessors to be the total taxable value of land and additions on the property. | Land | Improvement |
|---|---|---|---|---|
| 2025 | $3,836 | $160,188 | $60,000 | $100,188 |
| 2024 | $3,836 | $156,432 | $60,000 | $96,432 |
| 2023 | $3,554 | $144,396 | $60,000 | $84,396 |
| 2022 | $3,281 | $94,696 | $32,000 | $62,696 |
| 2021 | $2,615 | $94,696 | $32,000 | $62,696 |
| 2020 | $2,379 | $86,164 | $24,000 | $62,164 |
| 2019 | $2,258 | $81,660 | $24,000 | $57,660 |
| 2018 | $1,922 | $69,484 | $24,000 | $45,484 |
| 2017 | $1,845 | $66,476 | $24,000 | $42,476 |
| 2016 | $1,577 | $56,836 | $20,000 | $36,836 |
| 2015 | $1,469 | $52,836 | $16,000 | $36,836 |
| 2014 | $1,367 | $51,624 | $16,000 | $35,624 |
Source: Public Records
Map
Nearby Homes
- 390 Tidwell Rd
- 201 Tidwell Rd
- 255 White Pines Dr
- 3584 Archgate Ct
- 845 Miranda Terrace
- 13974 Sunfish Bend Unit 4103
- 3245 Highway 9 N
- 840 Central Park Overlook
- 860 Hargrove Point Way
- 3332 Seaward View
- 14183 Yacht Terrace Unit 107
- 3309 Regatta Grove
- 3307 Regatta Grove
- 3299 Regatta Grove
- 550 Central Park Overlook
- 1040 Peyton View Ct
- 419 Grayson Way
- 6660 Tulip Plantation Rd
- 368 Grayson Way
- 1465 Queens Ln
- 576 Tidwell Rd
- 333 Fernbank Ct
- 552 Tidwell Rd Unit 3
- 335 Fernbank Ct Unit 3
- 584 Tidwell Rd
- 331 Fernbank Ct
- 337 Fernbank Ct Unit 3
- 410 Huntington Dr
- 415 Huntington Dr
- 329 Fernbank Ct
- 544 Tidwell Rd Unit 3
- 585 Tidwell Rd Unit 2
- 339 Fernbank Ct
- 592 Tidwell Rd Unit 3
- 327 Fernbank Ct Unit 3
- 536 Tidwell Rd Unit 3
- 390 Huntington Cir
- 425 Huntington Dr
- 420 Huntington Dr
- 334 Fernbank Ct Unit 3