Estimated Value: $404,000 - $442,000
4
Beds
2
Baths
1,908
Sq Ft
$226/Sq Ft
Est. Value
About This Home
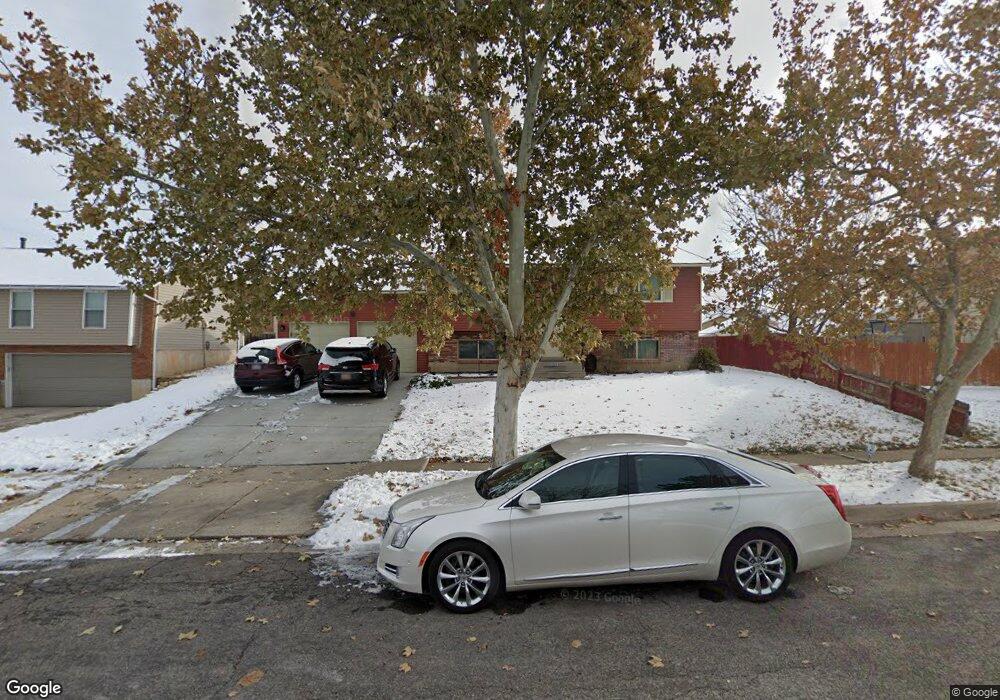
This home is located at 5680 S 4050 W, Roy, UT 84067 and is currently estimated at $431,090, approximately $225 per square foot. 5680 S 4050 W is a home located in Weber County with nearby schools including Freedom School, Roy Junior High School, and Roy High School.
Ownership History
Date
Name
Owned For
Owner Type
Purchase Details
Closed on
May 8, 2008
Sold by
Salazar Eduardo L
Bought by
Salazar Eduardo L
Current Estimated Value
Home Financials for this Owner
Home Financials are based on the most recent Mortgage that was taken out on this home.
Original Mortgage
$149,400
Interest Rate
5.88%
Mortgage Type
Stand Alone Refi Refinance Of Original Loan
Purchase Details
Closed on
Aug 6, 1997
Sold by
Spraw Tim and Spraw Ann
Bought by
Salazar Eduardo L
Home Financials for this Owner
Home Financials are based on the most recent Mortgage that was taken out on this home.
Original Mortgage
$110,160
Interest Rate
7.45%
Mortgage Type
VA
Create a Home Valuation Report for This Property
The Home Valuation Report is an in-depth analysis detailing your home's value as well as a comparison with similar homes in the area
Home Values in the Area
Average Home Value in this Area
Purchase History
| Date | Buyer | Sale Price | Title Company |
|---|---|---|---|
| Salazar Eduardo L | -- | First American Riverdale | |
| Salazar Eduardo L | -- | Mountain View Title |
Source: Public Records
Mortgage History
| Date | Status | Borrower | Loan Amount |
|---|---|---|---|
| Closed | Salazar Eduardo L | $149,400 | |
| Closed | Salazar Eduardo L | $110,160 |
Source: Public Records
Tax History Compared to Growth
Tax History
| Year | Tax Paid | Tax Assessment Tax Assessment Total Assessment is a certain percentage of the fair market value that is determined by local assessors to be the total taxable value of land and additions on the property. | Land | Improvement |
|---|---|---|---|---|
| 2025 | $2,295 | $398,973 | $142,554 | $256,419 |
| 2024 | $2,222 | $213,949 | $78,412 | $135,537 |
| 2023 | $2,145 | $206,800 | $69,001 | $137,799 |
| 2022 | $2,402 | $235,950 | $62,989 | $172,961 |
| 2021 | $1,815 | $295,000 | $83,142 | $211,858 |
| 2020 | $1,667 | $248,000 | $83,142 | $164,858 |
| 2019 | $1,730 | $243,000 | $47,672 | $195,328 |
| 2018 | $1,611 | $214,000 | $42,557 | $171,443 |
| 2017 | $1,519 | $190,000 | $42,557 | $147,443 |
| 2016 | $1,380 | $92,947 | $22,430 | $70,517 |
| 2015 | $1,195 | $82,906 | $22,430 | $60,476 |
| 2014 | $1,161 | $79,474 | $19,769 | $59,705 |
Source: Public Records
Map
Nearby Homes
- 5644 S 4075 W
- 5610 S 4075 W
- 3923 W 5700 S
- 3826 W 5750 S
- 5856 S 3950 W
- 5539 S 4175 W
- 3809 W 5625 S
- 5465 S 4050 W
- 4164 W 5950 S
- 3780 W 5850 S
- 4309 W 5430 St #B S
- 4342 W 5430 S Unit B
- 4276 W 6025 S
- 2592 W 2650 N
- 5235 Midland Dr
- 3766 W 5300 S
- 4337 W 5430 S Unit A
- 462 S 4450 W Unit 504
- 5270 S 4200 W
- 3607 W 5400 S