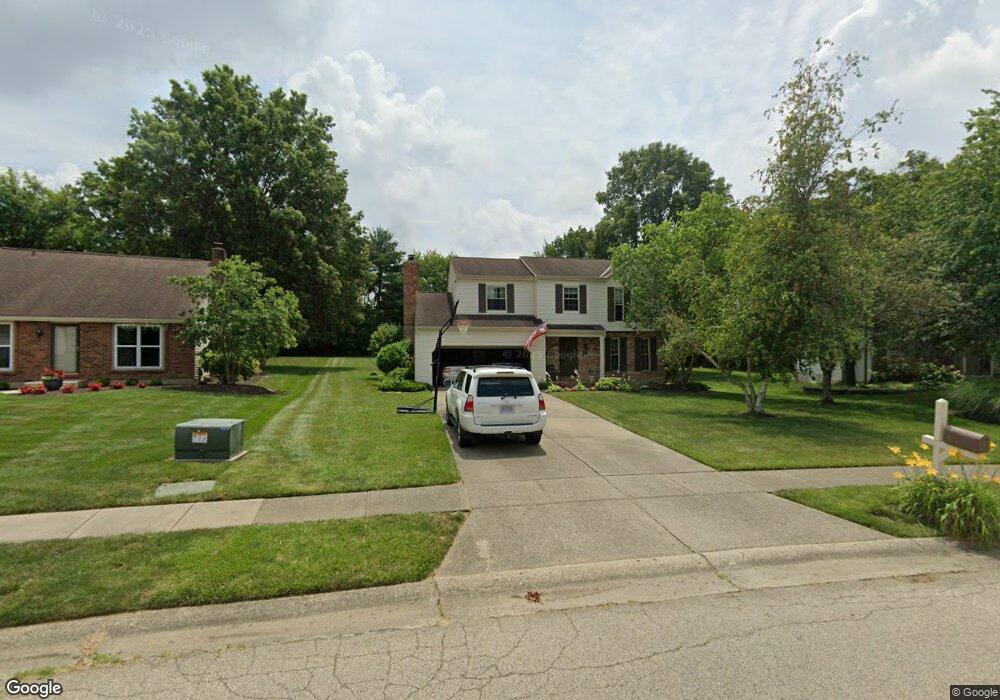
5681 Farm Field Dr Mason, OH 45040
Deerfield Township NeighborhoodEstimated Value: $359,000 - $485,000
3
Beds
3
Baths
2,116
Sq Ft
$210/Sq Ft
Est. Value
About This Home
This home is located at 5681 Farm Field Dr, Mason, OH 45040 and is currently estimated at $445,042, approximately $210 per square foot. 5681 Farm Field Dr is a home located in Warren County with nearby schools including Mason Intermediate Elementary School, Mason Middle School, and William Mason High School.
Ownership History
Date
Name
Owned For
Owner Type
Purchase Details
Closed on
Sep 10, 2001
Sold by
Allen Jeffrie L
Bought by
Williams Robert T and Williams Judith A
Current Estimated Value
Home Financials for this Owner
Home Financials are based on the most recent Mortgage that was taken out on this home.
Original Mortgage
$105,000
Interest Rate
7.03%
Mortgage Type
New Conventional
Purchase Details
Closed on
Aug 8, 1996
Sold by
Fiscus Jeffrey C
Bought by
Allen Jeffrie L and Allen G
Home Financials for this Owner
Home Financials are based on the most recent Mortgage that was taken out on this home.
Original Mortgage
$97,700
Interest Rate
8.33%
Mortgage Type
New Conventional
Purchase Details
Closed on
Dec 22, 1986
Sold by
Branyan Branyan and Branyan Eric R
Bought by
Fiscus Fiscus and Fiscus Jeffrey C
Purchase Details
Closed on
Sep 30, 1983
Sold by
Drees Company
Bought by
Branyan Branyan and Branyan Eric R
Purchase Details
Closed on
Jun 13, 1980
Sold by
Campbell Campbell and Campbell Kenneth R
Purchase Details
Closed on
Feb 13, 1980
Sold by
Campbell Campbell and Campbell Kenneth R
Create a Home Valuation Report for This Property
The Home Valuation Report is an in-depth analysis detailing your home's value as well as a comparison with similar homes in the area
Home Values in the Area
Average Home Value in this Area
Purchase History
| Date | Buyer | Sale Price | Title Company |
|---|---|---|---|
| Williams Robert T | $151,000 | -- | |
| Allen Jeffrie L | $132,700 | -- | |
| Fiscus Fiscus | $96,500 | -- | |
| Branyan Branyan | $87,500 | -- | |
| -- | $104,000 | -- | |
| -- | -- | -- |
Source: Public Records
Mortgage History
| Date | Status | Borrower | Loan Amount |
|---|---|---|---|
| Previous Owner | Williams Robert T | $105,000 | |
| Previous Owner | Allen Jeffrie L | $97,700 |
Source: Public Records
Tax History Compared to Growth
Tax History
| Year | Tax Paid | Tax Assessment Tax Assessment Total Assessment is a certain percentage of the fair market value that is determined by local assessors to be the total taxable value of land and additions on the property. | Land | Improvement |
|---|---|---|---|---|
| 2024 | $4,801 | $112,870 | $31,500 | $81,370 |
| 2023 | $4,826 | $93,516 | $21,525 | $71,991 |
| 2022 | $4,743 | $93,517 | $21,525 | $71,992 |
| 2021 | $4,133 | $85,691 | $21,525 | $64,166 |
| 2020 | $3,956 | $69,668 | $17,500 | $52,168 |
| 2019 | $3,664 | $69,668 | $17,500 | $52,168 |
| 2018 | $3,679 | $69,668 | $17,500 | $52,168 |
| 2017 | $3,429 | $59,899 | $12,079 | $47,821 |
| 2016 | $3,525 | $59,899 | $12,079 | $47,821 |
| 2015 | $3,534 | $59,899 | $12,079 | $47,821 |
| 2014 | $3,298 | $51,640 | $10,410 | $41,220 |
| 2013 | $3,305 | $60,750 | $12,250 | $48,500 |
Source: Public Records
Map
Nearby Homes
- 5819 Deer Run Dr
- 9575 Fox Run Dr
- 9766 Kensington Ln
- 5852 Fawn Run Dr
- 5857 Fawn Run Dr
- 9867 Kensington Ln
- 5625 Hunters Lake
- 9743 Snider Rd
- 9787 Snider Rd
- 9204 Beacon St
- 9147 Elizabeth Ln Unit 9147
- 9120 Boylston St
- 12173 Crestfield Ct
- 12130 Crestfield Ct
- 5532 Winding Cape Way
- 8659 Coveview Ct
- 8372 Heritage Dr
- 12102 Paulmeadows Dr
- 5369 N Shore Place
- 9679 Blackbird Place
- 5671 Farm Field Dr
- 5691 Farm Field Dr
- 5732 Victoria Rd
- 5701 Farm Field Dr
- 5740 Victoria Rd
- 5659 Farm Field Dr
- 5748 Victoria Rd
- 5724 Victoria Rd
- 5579 Old Farm Dr
- 5756 Victoria Rd
- 5716 Victoria Rd
- 5686 Farm Field Dr
- 5589 Old Farm Dr
- 5715 Farm Field Dr
- 5660 Farm Field Dr
- 5764 Victoria Rd
- 5708 Victoria Rd
- 5704 Farm Field Dr
- 5700 Victoria Rd
- 5772 Victoria Rd