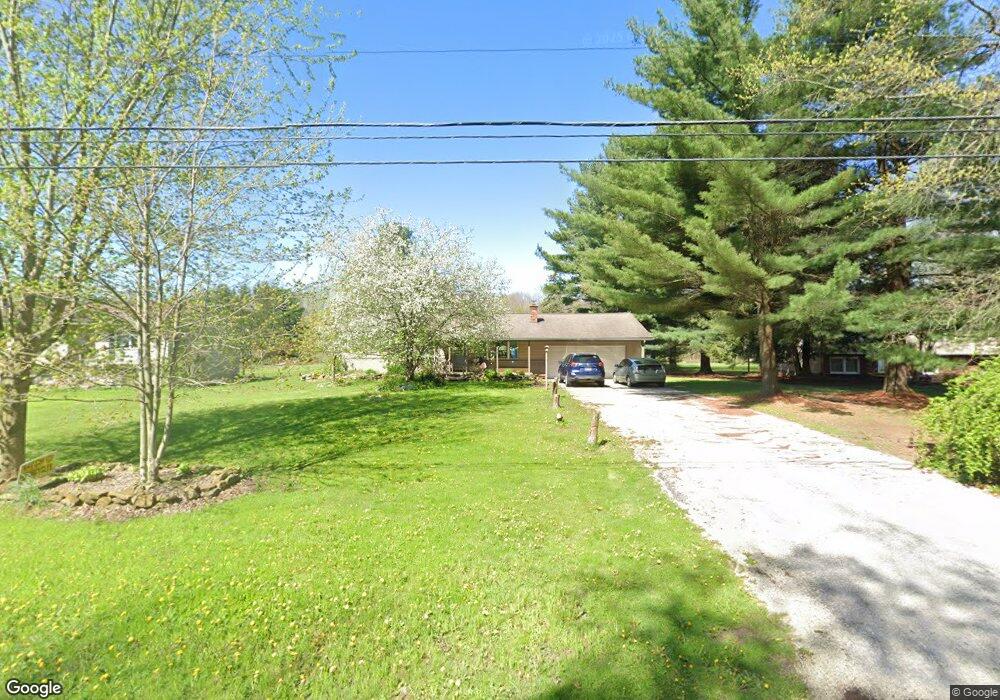
5681 Ridge Rd Cortland, OH 44410
Estimated Value: $111,000 - $171,929
3
Beds
1
Bath
1,066
Sq Ft
$139/Sq Ft
Est. Value
About This Home
This home is located at 5681 Ridge Rd, Cortland, OH 44410 and is currently estimated at $148,482, approximately $139 per square foot. 5681 Ridge Rd is a home located in Trumbull County with nearby schools including Maplewood Middle School, Maplewood Elementary School, and Maplewood High School.
Ownership History
Date
Name
Owned For
Owner Type
Purchase Details
Closed on
Sep 29, 2003
Sold by
Warner Martha Jane
Bought by
Barboza Carole Jo
Current Estimated Value
Home Financials for this Owner
Home Financials are based on the most recent Mortgage that was taken out on this home.
Original Mortgage
$67,200
Outstanding Balance
$31,617
Interest Rate
6.33%
Mortgage Type
New Conventional
Estimated Equity
$116,865
Purchase Details
Closed on
Jan 1, 1990
Bought by
Jack Arden Warner
Create a Home Valuation Report for This Property
The Home Valuation Report is an in-depth analysis detailing your home's value as well as a comparison with similar homes in the area
Home Values in the Area
Average Home Value in this Area
Purchase History
| Date | Buyer | Sale Price | Title Company |
|---|---|---|---|
| Barboza Carole Jo | $84,000 | -- | |
| Jack Arden Warner | -- | -- |
Source: Public Records
Mortgage History
| Date | Status | Borrower | Loan Amount |
|---|---|---|---|
| Open | Barboza Carole Jo | $67,200 |
Source: Public Records
Tax History Compared to Growth
Tax History
| Year | Tax Paid | Tax Assessment Tax Assessment Total Assessment is a certain percentage of the fair market value that is determined by local assessors to be the total taxable value of land and additions on the property. | Land | Improvement |
|---|---|---|---|---|
| 2024 | $1,908 | $46,560 | $4,450 | $42,110 |
| 2023 | $1,908 | $46,560 | $4,450 | $42,110 |
| 2022 | $1,454 | $32,550 | $4,060 | $28,490 |
| 2021 | $1,530 | $32,550 | $4,060 | $28,490 |
| 2020 | $1,537 | $32,550 | $4,060 | $28,490 |
| 2019 | $1,450 | $29,200 | $3,750 | $25,450 |
| 2018 | $1,409 | $29,200 | $3,750 | $25,450 |
| 2017 | $1,406 | $29,200 | $3,750 | $25,450 |
| 2016 | $1,251 | $26,920 | $3,430 | $23,490 |
| 2015 | $1,248 | $26,920 | $3,430 | $23,490 |
| 2014 | $1,243 | $26,920 | $3,430 | $23,490 |
| 2013 | $1,279 | $26,920 | $3,430 | $23,490 |
Source: Public Records
Map
Nearby Homes
- 2684 Griffith Dr
- 6148 Youngstown Kingsville Rd
- 5150 Phillips Rice Rd
- 4366 Greenville Rd
- 5059 Phillips Rice Rd
- 6555 Love Warner Rd
- 121 Fairway Dr
- 4869 Phillips Rice Rd
- 428 Cherry Hill Ln
- 507 Tournament Trail
- 0 St Andrews Unit 5113795
- 6101 Private
- 525 Sycamore Trail
- 404 Cherry Hill Ln
- 400 Tournament Trail Unit 400
- 6277 Youngstown Kingsville Rd
- 160 Saint Andrews
- 288 Butternut Cir
- 3461 Everett Hull Rd
- 124 Saint Andrews