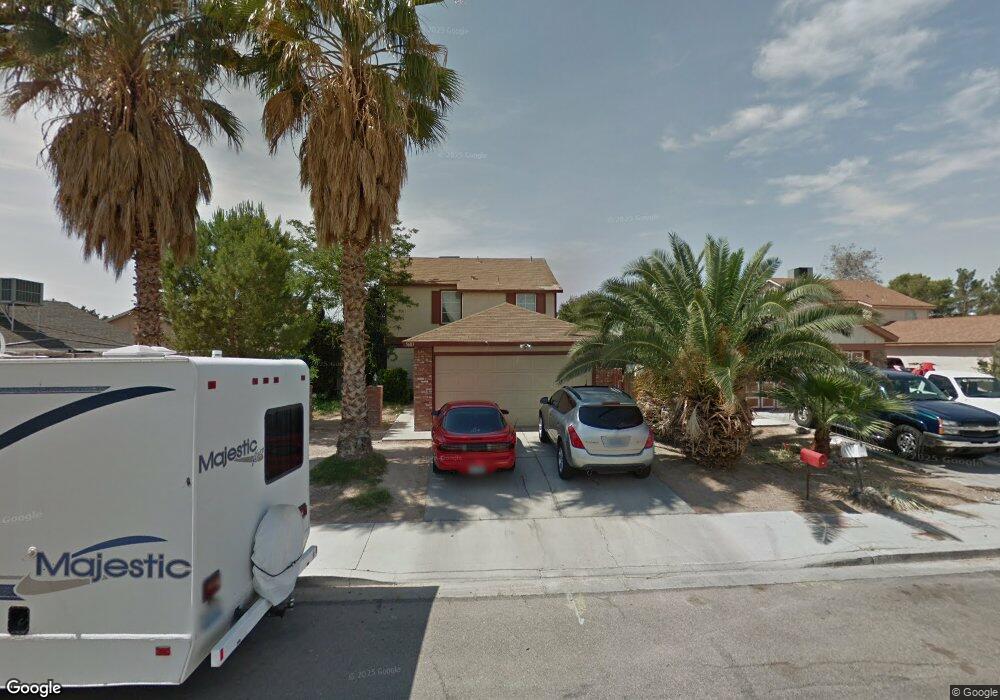
5683 Moapa Ct Unit 7 Las Vegas, NV 89110
Estimated Value: $357,501 - $378,000
3
Beds
2
Baths
1,392
Sq Ft
$264/Sq Ft
Est. Value
About This Home
This home is located at 5683 Moapa Ct Unit 7, Las Vegas, NV 89110 and is currently estimated at $367,375, approximately $263 per square foot. 5683 Moapa Ct Unit 7 is a home located in Clark County with nearby schools including Richard J. Rundle Elementary School, Charlotte & Jerry Keller Elementary School, and Duane D. Keller Middle School.
Ownership History
Date
Name
Owned For
Owner Type
Purchase Details
Closed on
Oct 28, 2002
Sold by
Smith Jeff W and Smith Dorera M
Bought by
Lopez Gary L and Sandusky Lena A
Current Estimated Value
Home Financials for this Owner
Home Financials are based on the most recent Mortgage that was taken out on this home.
Original Mortgage
$127,893
Outstanding Balance
$53,293
Interest Rate
5.95%
Mortgage Type
FHA
Estimated Equity
$314,082
Purchase Details
Closed on
Nov 13, 1997
Sold by
Raimondi Salvatore and Raimondi Beatrice
Bought by
Smith Jeff W and Smith Dorena M
Purchase Details
Closed on
Jul 11, 1997
Sold by
Smith Jeff W and Smith Dorena M
Bought by
Raimondi Salvatore and Raimondi Beatrice
Purchase Details
Closed on
Aug 13, 1993
Sold by
Raimondi Salvatore and Raimondi Beatrice
Bought by
Smith Jeff W and Smith Dorena M
Create a Home Valuation Report for This Property
The Home Valuation Report is an in-depth analysis detailing your home's value as well as a comparison with similar homes in the area
Home Values in the Area
Average Home Value in this Area
Purchase History
| Date | Buyer | Sale Price | Title Company |
|---|---|---|---|
| Lopez Gary L | $129,900 | Old Republic Title Company | |
| Smith Jeff W | $12,500 | -- | |
| Raimondi Salvatore | $7,000 | -- | |
| Smith Jeff W | $4,000 | -- |
Source: Public Records
Mortgage History
| Date | Status | Borrower | Loan Amount |
|---|---|---|---|
| Open | Lopez Gary L | $127,893 |
Source: Public Records
Tax History Compared to Growth
Tax History
| Year | Tax Paid | Tax Assessment Tax Assessment Total Assessment is a certain percentage of the fair market value that is determined by local assessors to be the total taxable value of land and additions on the property. | Land | Improvement |
|---|---|---|---|---|
| 2025 | $692 | $54,671 | $25,900 | $28,771 |
| 2024 | $672 | $54,671 | $25,900 | $28,771 |
| 2023 | $548 | $54,408 | $26,250 | $28,158 |
| 2022 | $653 | $48,456 | $22,400 | $26,056 |
| 2021 | $634 | $46,153 | $21,000 | $25,153 |
| 2020 | $612 | $44,551 | $19,250 | $25,301 |
| 2019 | $594 | $42,705 | $17,500 | $25,205 |
| 2018 | $577 | $36,257 | $11,900 | $24,357 |
| 2017 | $1,028 | $35,049 | $10,150 | $24,899 |
| 2016 | $548 | $33,972 | $8,400 | $25,572 |
| 2015 | $546 | $28,073 | $6,650 | $21,423 |
| 2014 | $530 | $17,516 | $4,550 | $12,966 |
Source: Public Records
Map
Nearby Homes
- 522 Wheaties Way
- 316 Linn Ln
- 5529 Cedar Ave
- 5854 Heather Marie Dr
- 360 Sir Richard Dr E
- 262 Solicito St
- 656 N Christy Ln
- 332 Sir Jeffery Cir
- 266 Lyra Ln
- 5907 Zawawi Ct
- 741 Round Table Dr
- 730 N Christy Ln
- 280 Sir Phillip St
- 5364 Awbury Ave
- 147 N Christy Ln
- 0 Washington Unit 2360795
- 0 Madge Ln
- 5564 Orchard Ln Unit 133
- 5583 Orchard Ln Unit 152
- 5275 Hagemann Ln
- 5675 Moapa Ct Unit 7
- 441 Linn Ln
- 5667 Moapa Ct
- 429 Linn Ln
- 5682 Coaldale Place
- 5674 Coaldale Place
- 423 Linn Ln
- 453 Linn Ln
- 5684 Moapa Ct
- 5692 Moapa Ct
- 5659 Moapa Ct
- 5666 Coaldale Place Unit 7
- 5676 Moapa Ct
- 5651 Moapa Ct
- 459 Linn Ln
- 5668 Moapa Ct
- 5658 Coaldale Place
- 5652 Moapa Ct Unit 7
- 442 Linn Ln
- 5660 Moapa Ct