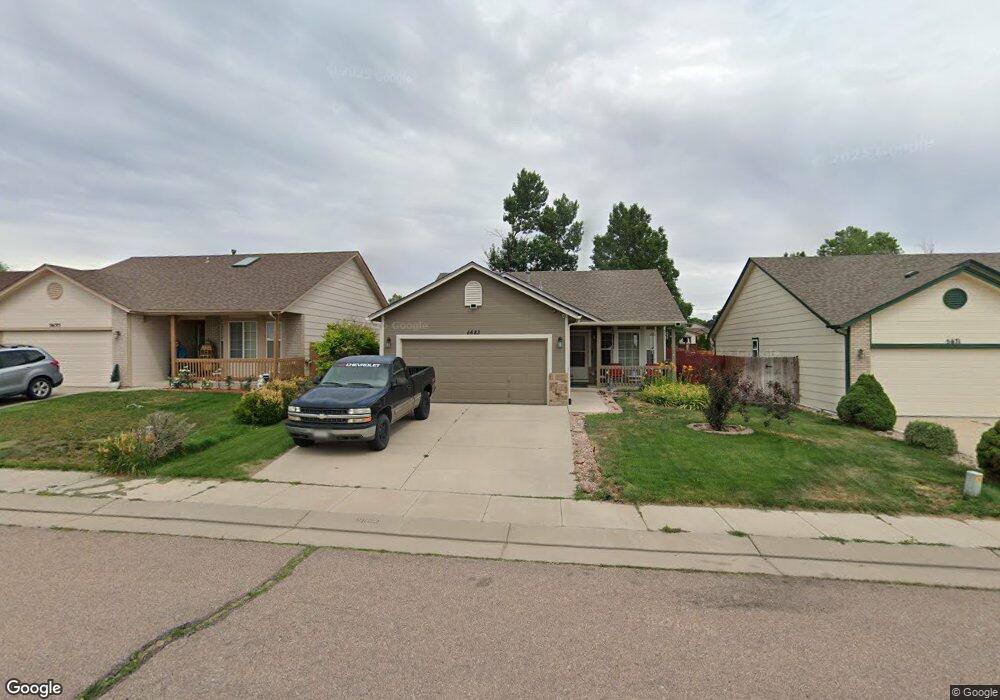
5683 Preminger Dr Colorado Springs, CO 80911
Security-Widefield NeighborhoodEstimated Value: $360,184 - $406,000
4
Beds
2
Baths
1,064
Sq Ft
$364/Sq Ft
Est. Value
About This Home
This home is located at 5683 Preminger Dr, Colorado Springs, CO 80911 and is currently estimated at $387,546, approximately $364 per square foot. 5683 Preminger Dr is a home located in El Paso County with nearby schools including French Elementary School, Sproul Junior High School, and Widefield High School.
Ownership History
Date
Name
Owned For
Owner Type
Purchase Details
Closed on
Jan 2, 2019
Sold by
Ben Manuel
Bought by
Ben Manuel Anthony and Smith Marcie Kay
Current Estimated Value
Home Financials for this Owner
Home Financials are based on the most recent Mortgage that was taken out on this home.
Original Mortgage
$75,000
Outstanding Balance
$48,163
Interest Rate
4.8%
Mortgage Type
New Conventional
Estimated Equity
$339,383
Purchase Details
Closed on
Feb 22, 2002
Sold by
Mcwilliams Glen H and Mcwilliams Sheryl A
Bought by
Ben Manuel
Home Financials for this Owner
Home Financials are based on the most recent Mortgage that was taken out on this home.
Original Mortgage
$85,000
Interest Rate
7.05%
Purchase Details
Closed on
Jun 25, 1999
Sold by
New Generation Homes Inc
Bought by
Mcwilliams Glen H and Mcwilliams Sheryi A
Home Financials for this Owner
Home Financials are based on the most recent Mortgage that was taken out on this home.
Original Mortgage
$114,213
Interest Rate
7.21%
Mortgage Type
FHA
Create a Home Valuation Report for This Property
The Home Valuation Report is an in-depth analysis detailing your home's value as well as a comparison with similar homes in the area
Home Values in the Area
Average Home Value in this Area
Purchase History
| Date | Buyer | Sale Price | Title Company |
|---|---|---|---|
| Ben Manuel Anthony | -- | Unified Title Co | |
| Ben Manuel | $164,900 | Security Title | |
| Mcwilliams Glen H | $115,200 | Unified Title Co Inc |
Source: Public Records
Mortgage History
| Date | Status | Borrower | Loan Amount |
|---|---|---|---|
| Open | Ben Manuel Anthony | $75,000 | |
| Closed | Ben Manuel | $85,000 | |
| Previous Owner | Mcwilliams Glen H | $114,213 |
Source: Public Records
Tax History Compared to Growth
Tax History
| Year | Tax Paid | Tax Assessment Tax Assessment Total Assessment is a certain percentage of the fair market value that is determined by local assessors to be the total taxable value of land and additions on the property. | Land | Improvement |
|---|---|---|---|---|
| 2025 | $1,825 | $27,430 | -- | -- |
| 2024 | $1,772 | $28,260 | $5,750 | $22,510 |
| 2023 | $1,772 | $28,260 | $5,750 | $22,510 |
| 2022 | $1,497 | $20,050 | $3,980 | $16,070 |
| 2021 | $1,614 | $20,630 | $4,090 | $16,540 |
| 2020 | $1,416 | $17,580 | $3,580 | $14,000 |
| 2019 | $1,408 | $17,580 | $3,580 | $14,000 |
| 2018 | $1,282 | $14,940 | $2,680 | $12,260 |
| 2017 | $1,297 | $14,940 | $2,680 | $12,260 |
| 2016 | $1,032 | $14,520 | $2,850 | $11,670 |
| 2015 | $1,058 | $14,520 | $2,850 | $11,670 |
| 2014 | $966 | $13,310 | $2,560 | $10,750 |
Source: Public Records
Map
Nearby Homes
- 770 Stargate Dr
- 5430 Wilhelm Dr
- 570 Jayton Dr
- 1124 Hallamwood Dr
- 655 Hugh Martin St
- 530 Jayton Dr
- 7119 Passing Sky Dr
- 4968 Wolf Moon Dr
- 7072 Passing Sky Dr
- 1240 Quinlan Ct
- 4928 Wolf Moon Dr
- 480 Athens Dr
- 7000 Passing Sky Dr
- 4980 Wilkin Dr
- 4803 Brant Rd
- 4953 Escanaba Dr
- 4858 Wolf Moon Dr
- 5175 Almont Ave
- 4959 Gami Way
- 4966 Spokane Way
- 5695 Preminger Dr
- 5671 Preminger Dr
- 5707 Preminger Dr
- 5659 Preminger Dr
- 5719 Preminger Dr
- 5684 Preminger Dr
- 5647 Preminger Dr
- 5660 Preminger Dr
- 5696 Preminger Dr
- 5648 Preminger Dr
- 5708 Preminger Dr
- 850 Stargate Dr
- 5731 Preminger Dr
- 840 Stargate Dr
- 860 Stargate Dr
- 5635 Preminger Dr
- 5720 Preminger Dr
- 870 Stargate Dr
- 5743 Preminger Dr
- 5623 Preminger Dr