5685 Saddle Rock Rd Colorado Springs, CO 80918
Vista Grande NeighborhoodEstimated Value: $553,545 - $628,000
5
Beds
3
Baths
2,493
Sq Ft
$243/Sq Ft
Est. Value
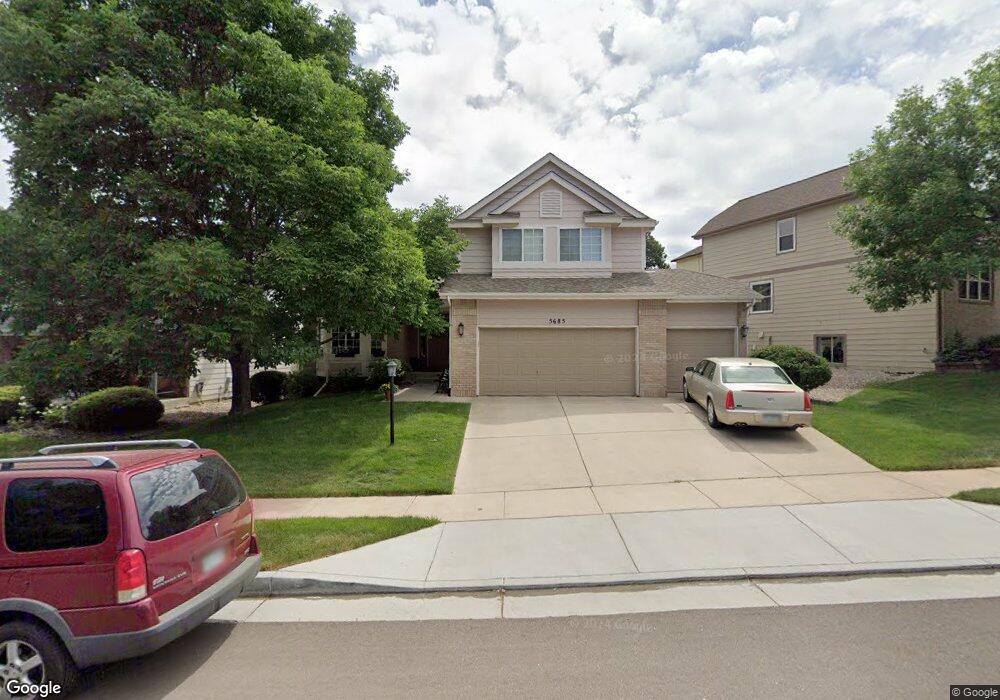
About This Home
This home is located at 5685 Saddle Rock Rd, Colorado Springs, CO 80918 and is currently estimated at $606,636, approximately $243 per square foot. 5685 Saddle Rock Rd is a home located in El Paso County with nearby schools including Martinez Elementary School, Jenkins Middle School, and Doherty High School.
Ownership History
Date
Name
Owned For
Owner Type
Purchase Details
Closed on
Apr 8, 2003
Sold by
Prudential Relocation Inc
Bought by
Gresham Raleigh G and Gresham Mary L
Current Estimated Value
Home Financials for this Owner
Home Financials are based on the most recent Mortgage that was taken out on this home.
Original Mortgage
$50,000
Interest Rate
5.12%
Mortgage Type
Credit Line Revolving
Purchase Details
Closed on
Feb 15, 1995
Sold by
Richmond Homes Inc Ii
Bought by
Worsham Grover C and Worsham Elizabeth A
Home Financials for this Owner
Home Financials are based on the most recent Mortgage that was taken out on this home.
Original Mortgage
$186,500
Interest Rate
9.14%
Mortgage Type
VA
Purchase Details
Closed on
Apr 10, 1992
Bought by
Gresham Raleigh G
Purchase Details
Closed on
Sep 26, 1991
Bought by
Gresham Raleigh G
Purchase Details
Closed on
Mar 20, 1991
Bought by
Gresham Raleigh G
Purchase Details
Closed on
Jul 1, 1987
Bought by
Gresham Mary L
Create a Home Valuation Report for This Property
The Home Valuation Report is an in-depth analysis detailing your home's value as well as a comparison with similar homes in the area
Home Values in the Area
Average Home Value in this Area
Purchase History
| Date | Buyer | Sale Price | Title Company |
|---|---|---|---|
| Gresham Raleigh G | $252,500 | Chicago Title Co | |
| Prudential Relocation Inc | $252,500 | Chicago Title Co | |
| Worsham Grover C | $186,500 | Land Title | |
| Gresham Raleigh G | -- | -- | |
| Gresham Raleigh G | -- | -- | |
| Gresham Raleigh G | -- | -- | |
| Gresham Mary L | -- | -- |
Source: Public Records
Mortgage History
| Date | Status | Borrower | Loan Amount |
|---|---|---|---|
| Closed | Prudential Relocation Inc | $50,000 | |
| Open | Gresham Raleigh G | $202,000 | |
| Previous Owner | Worsham Grover C | $186,500 |
Source: Public Records
Tax History Compared to Growth
Tax History
| Year | Tax Paid | Tax Assessment Tax Assessment Total Assessment is a certain percentage of the fair market value that is determined by local assessors to be the total taxable value of land and additions on the property. | Land | Improvement |
|---|---|---|---|---|
| 2025 | $1,938 | $36,910 | -- | -- |
| 2024 | $1,427 | $36,970 | $5,530 | $31,440 |
| 2023 | $1,427 | $36,970 | $5,530 | $31,440 |
| 2022 | $1,196 | $26,920 | $4,900 | $22,020 |
| 2021 | $1,293 | $27,690 | $5,040 | $22,650 |
| 2020 | $1,573 | $21,910 | $4,380 | $17,530 |
| 2019 | $1,565 | $21,910 | $4,380 | $17,530 |
| 2018 | $1,520 | $19,660 | $4,410 | $15,250 |
| 2017 | $1,444 | $19,660 | $4,410 | $15,250 |
| 2016 | $1,232 | $19,900 | $4,480 | $15,420 |
| 2015 | $1,228 | $19,900 | $4,480 | $15,420 |
| 2014 | $1,203 | $18,770 | $4,480 | $14,290 |
Source: Public Records
Map
Nearby Homes
- 5739 Wells Fargo Dr E
- 4735 Seton Place
- 4740 Rustler Ct
- 5745 Doe Skin Ct
- 6243 Fowler Mill Point
- 6256 Fowler Mill Point
- 6103 Treeledge Dr
- 4718 Rowland Heights
- 5978 Maroon Mesa Dr
- 6315 Andersen Mill Heights Unit 206
- 5347 Wells Fargo Dr
- 4790 Wells Branch Heights Unit 204
- 4543 Clark Fork Place
- 6465 Whirlwind Dr
- 4431 Flat Top Place
- 5635 Altitude Dr
- 5904 Mapleton Dr
- 4265 Dolphin Cir
- 6515 Medicine Springs Dr
- 6030 Barnacle Ct
- 5675 Saddle Rock Rd
- 5695 Saddle Rock Rd
- 5655 Saddle Rock Rd
- 5740 Wells Fargo Dr E
- 5730 Wells Fargo Dr E
- 5680 Saddle Rock Rd
- 5753 Wells Fargo Dr
- 5720 Wells Fargo Dr E
- 5670 Saddle Rock Rd
- 5645 Saddle Rock Rd
- 5660 Saddle Rock Rd
- 5755 Wells Fargo Dr E
- 5710 Wells Fargo Dr E
- 5731 Wells Fargo Dr
- 5650 Saddle Rock Rd
- 5735 Wells Fargo Dr E
- 5745 Wells Fargo Dr E
- 5725 Wells Fargo Dr E
- 5707 Wells Fargo Dr
- 5635 Saddle Rock Rd