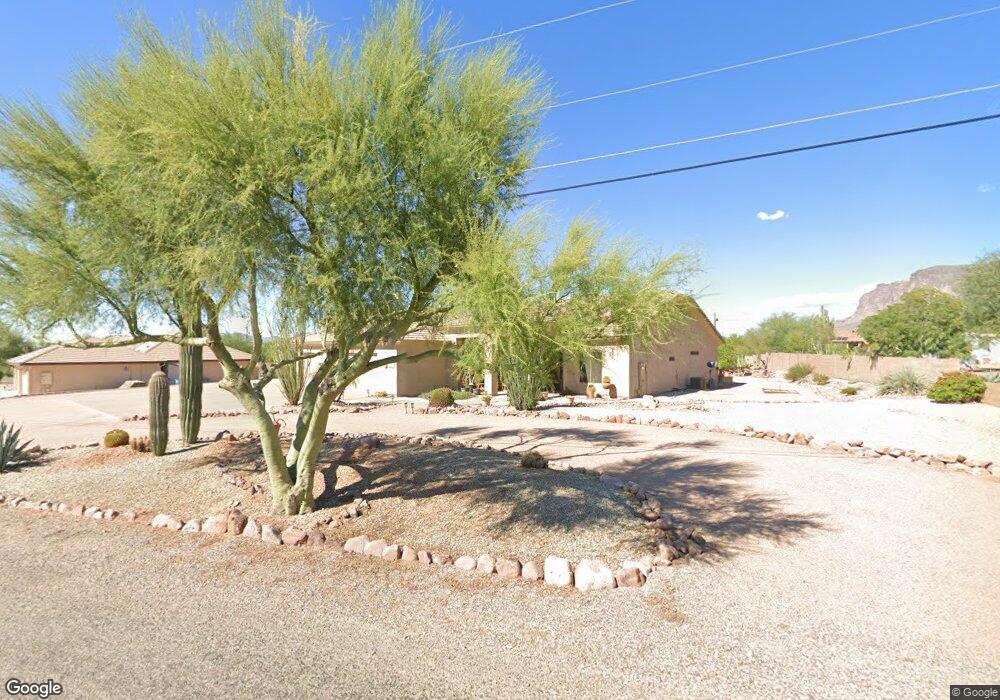
5688 E 20th Ave Apache Junction, AZ 85119
Estimated Value: $762,000 - $894,000
3
Beds
3
Baths
2,400
Sq Ft
$345/Sq Ft
Est. Value
About This Home
This home is located at 5688 E 20th Ave, Apache Junction, AZ 85119 and is currently estimated at $827,594, approximately $344 per square foot. 5688 E 20th Ave is a home located in Pinal County with nearby schools including Desert Vista Elementary School, Cactus Canyon Junior High School, and Apache Junction High School.
Ownership History
Date
Name
Owned For
Owner Type
Purchase Details
Closed on
Jul 25, 2005
Sold by
Wingfield Jack L and Wingfield Nancy C
Bought by
Wingfield Jackie L and Wingfield Nancy C
Current Estimated Value
Purchase Details
Closed on
Aug 27, 2002
Sold by
Kerr William G and Kerr Carol A
Bought by
Wingfield Jack L and Wingfield Nancy C
Purchase Details
Closed on
Oct 29, 2001
Sold by
Kerr William Gary and Kerr Carol Ann
Bought by
Kerr William G and Kerr Carol A
Home Financials for this Owner
Home Financials are based on the most recent Mortgage that was taken out on this home.
Original Mortgage
$244,800
Interest Rate
6.12%
Purchase Details
Closed on
Oct 4, 2000
Sold by
Morgan James I and Morgan Edna A
Bought by
Kerr William G and Kerr Carol A
Home Financials for this Owner
Home Financials are based on the most recent Mortgage that was taken out on this home.
Original Mortgage
$245,100
Interest Rate
7.96%
Mortgage Type
New Conventional
Create a Home Valuation Report for This Property
The Home Valuation Report is an in-depth analysis detailing your home's value as well as a comparison with similar homes in the area
Home Values in the Area
Average Home Value in this Area
Purchase History
| Date | Buyer | Sale Price | Title Company |
|---|---|---|---|
| Wingfield Jackie L | -- | -- | |
| Wingfield Jack L | $307,000 | Old Republic Title Agency | |
| Kerr William G | -- | First American Title | |
| Kerr William G | $258,000 | First American Title |
Source: Public Records
Mortgage History
| Date | Status | Borrower | Loan Amount |
|---|---|---|---|
| Previous Owner | Kerr William G | $244,800 | |
| Previous Owner | Kerr William G | $245,100 |
Source: Public Records
Tax History
| Year | Tax Paid | Tax Assessment Tax Assessment Total Assessment is a certain percentage of the fair market value that is determined by local assessors to be the total taxable value of land and additions on the property. | Land | Improvement |
|---|---|---|---|---|
| 2025 | $4,082 | $61,593 | -- | -- |
| 2024 | $3,835 | $60,586 | -- | -- |
| 2023 | $4,016 | $49,126 | $10,654 | $38,472 |
| 2022 | $3,835 | $41,194 | $7,025 | $34,169 |
| 2021 | $3,957 | $36,911 | $0 | $0 |
| 2020 | $3,859 | $33,954 | $0 | $0 |
| 2019 | $3,693 | $32,109 | $0 | $0 |
| 2018 | $3,612 | $30,843 | $0 | $0 |
| 2017 | $3,521 | $33,328 | $0 | $0 |
| 2016 | $3,413 | $32,368 | $5,082 | $27,286 |
| 2014 | $3,278 | $21,480 | $3,550 | $17,930 |
Source: Public Records
Map
Nearby Homes
- 1502 S Prospectors Rd
- 5107 E 14th Ave
- 1291 S Red Rock Ct
- 5580 E 10th Ave
- 1015 S Prospectors Rd
- 1067 S Trigger Ct
- 6569 E Javalina Ct
- E W Broadway Ave
- 000 E Tbd Lot 3 --
- 000 E Tbd Lot 3 -- Unit 3
- 000 E Tbd-Lot 4 --
- 000 E Tbd Lot 4 -- Unit 4
- 6619 E Quail Hideaway Ln
- 2466 S Pinyon Village Dr
- 822 S Broadway Ln
- 7255 E Grand View Ln Unit 86
- 00 E Calle Suenos Unit 2
- 5660 E Calle Mirage
- 6620 E Flat Iron Loop Unit 59
- 6590 E Flat Iron Loop Unit 55
- 5650 E 20th Ave
- 1885 S Geronimo Rd
- 5770 E 20th Ave
- 5733 E 18th Ave
- 5721 E 20th Ave
- 1825 S Geronimo Rd
- 5737 E 20th Ave Unit 1
- 1860 S Geronimo Rd
- 2075 S Geronimo Rd
- 5775 E 20th Ave
- 5824 E 20th Ave
- Aprox 3494 S Geronimo Rd
- XXXX S Geronimo Rd
- XXXX S Geronimo Rd
- 1090 S Geronimo Rd
- 3581 S Geronimo Rd
- 3581 S Geronimo Rd
- 1090 S Geronimo Rd Unit A
- 1090 S Geronimo Rd Unit B
- 1090 S Geronimo Rd Unit D
Your Personal Tour Guide
Ask me questions while you tour the home.