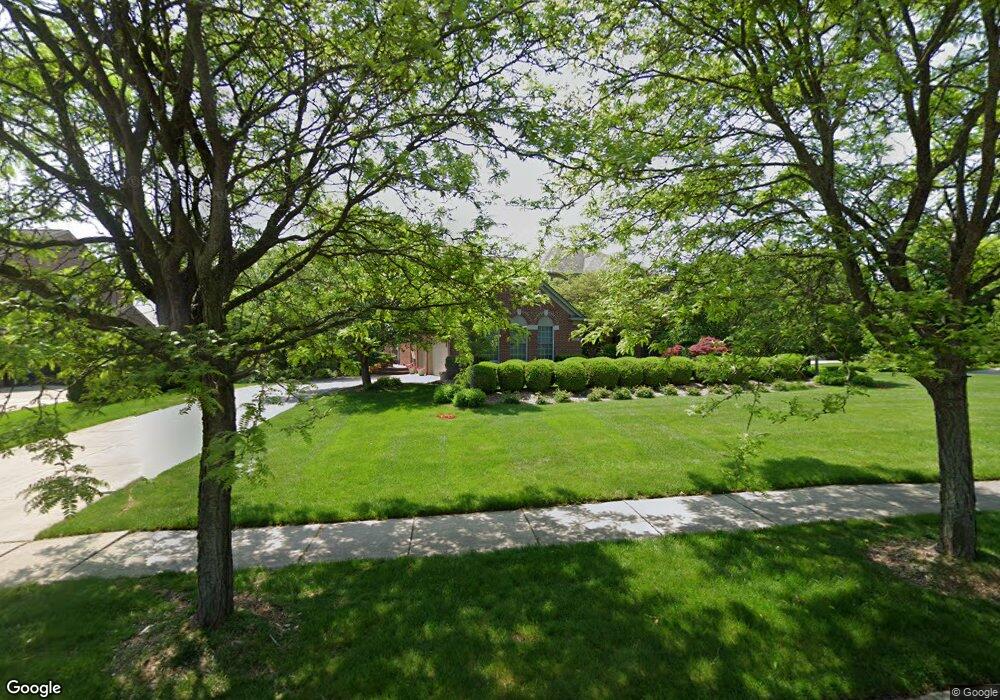
5688 Stonehaven Blvd Unit Bldg-Unit Rochester, MI 48306
Estimated Value: $872,570 - $944,000
4
Beds
5
Baths
3,377
Sq Ft
$273/Sq Ft
Est. Value
About This Home
This home is located at 5688 Stonehaven Blvd Unit Bldg-Unit, Rochester, MI 48306 and is currently estimated at $920,393, approximately $272 per square foot. 5688 Stonehaven Blvd Unit Bldg-Unit is a home located in Oakland County with nearby schools including Delta Kelly Elementary School, Van Hoosen Middle School, and Rochester Adams High School.
Ownership History
Date
Name
Owned For
Owner Type
Purchase Details
Closed on
Jun 7, 2018
Sold by
Fisher Danny J and Fisher Margaret A
Bought by
Mcneil Ryan P and Mcneil Kristina E
Current Estimated Value
Home Financials for this Owner
Home Financials are based on the most recent Mortgage that was taken out on this home.
Original Mortgage
$51,300
Outstanding Balance
$44,366
Interest Rate
4.5%
Mortgage Type
New Conventional
Estimated Equity
$876,027
Purchase Details
Closed on
Dec 8, 2017
Sold by
Fisher Danny J and Fisher Margaret A
Bought by
Fisher Danny J and Fisher Margaret A
Purchase Details
Closed on
Jul 19, 2002
Sold by
Pulte Land Co
Bought by
Fisher Danny J
Home Financials for this Owner
Home Financials are based on the most recent Mortgage that was taken out on this home.
Original Mortgage
$300,000
Interest Rate
6.62%
Create a Home Valuation Report for This Property
The Home Valuation Report is an in-depth analysis detailing your home's value as well as a comparison with similar homes in the area
Home Values in the Area
Average Home Value in this Area
Purchase History
| Date | Buyer | Sale Price | Title Company |
|---|---|---|---|
| Mcneil Ryan P | $570,000 | First American Title Insuran | |
| Fisher Danny J | -- | None Available | |
| Fisher Danny J | $190,000 | -- |
Source: Public Records
Mortgage History
| Date | Status | Borrower | Loan Amount |
|---|---|---|---|
| Open | Mcneil Ryan P | $51,300 | |
| Previous Owner | Fisher Danny J | $300,000 |
Source: Public Records
Tax History Compared to Growth
Tax History
| Year | Tax Paid | Tax Assessment Tax Assessment Total Assessment is a certain percentage of the fair market value that is determined by local assessors to be the total taxable value of land and additions on the property. | Land | Improvement |
|---|---|---|---|---|
| 2024 | $4,882 | $324,330 | $0 | $0 |
| 2023 | $4,695 | $291,540 | $0 | $0 |
| 2022 | $6,958 | $281,490 | $0 | $0 |
| 2021 | $6,507 | $271,680 | $0 | $0 |
| 2020 | $4,536 | $262,940 | $0 | $0 |
| 2019 | $6,938 | $261,630 | $0 | $0 |
| 2018 | $6,023 | $261,930 | $0 | $0 |
| 2017 | $5,925 | $258,050 | $0 | $0 |
| 2016 | $5,894 | $256,050 | $0 | $0 |
| 2015 | -- | $252,290 | $0 | $0 |
| 2014 | -- | $245,360 | $0 | $0 |
| 2011 | -- | $196,840 | $0 | $0 |
Source: Public Records
Map
Nearby Homes
- 5466 Orchard Ridge Dr
- 5350 Brewster Rd
- 1811 Blue Grass Dr
- 4831 Goodison Place Dr
- 1996 Tall Oaks Blvd
- 0000 Silver Bell Rd
- 1701 Silver Bell Rd
- 1865 Archers Pointe
- 1800 Silverbell Rd
- 1938 Kilburn Rd N
- 5300 Old Mill Rd
- 1515 Chevy Circuit
- 2750 Castlemartin Ct Unit 22
- 5826 Murfield Dr
- 1513 Lomas Verdes
- 4732 Goodison Place Dr
- 1536 Royal Crescent St
- 2935 Woodford Cir
- 4688 Fawn Hill Ct
- 2879 Hastings Ct Unit 73
- 5688 Stonehaven Blvd
- 5704 Stonehaven Blvd
- 5769 Birkenhills Ct
- 5744 Birkenhills Ct
- 5720 Stonehaven Blvd
- 5734 Birkenhills Ct
- 5764 Birkenhills Ct
- 5703 Stonehaven Blvd
- 5795 Birkenhills Ct
- 5794 Birkenhills Ct
- 2060 Stirling Ct
- 5671 Stonehaven Blvd
- 5719 Stonehaven Blvd
- 5740 Stonehaven Blvd
- 2082 Stirling Ct
- 5823 Birkenhills Ct Unit Bldg-Unit
- 5823 Birkenhills Ct
- 5735 Stonehaven Blvd
- 5834 Birkenhills Ct
- 5814 Birkenhills Ct