Estimated Value: $195,000 - $275,000
3
Beds
1
Bath
1,406
Sq Ft
$157/Sq Ft
Est. Value
About This Home
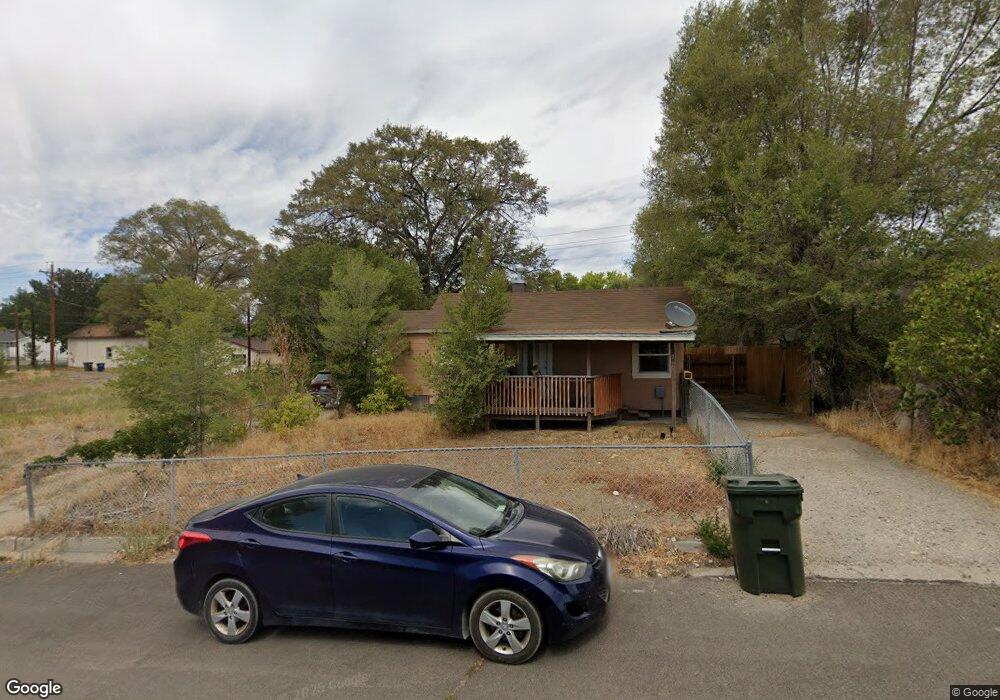
This home is located at 569 Ash St, Elko, NV 89801 and is currently estimated at $221,003, approximately $157 per square foot. 569 Ash St is a home located in Elko County with nearby schools including Elko Grammar School #2, Flagview Intermediate School, and Adobe Middle School.
Ownership History
Date
Name
Owned For
Owner Type
Purchase Details
Closed on
May 18, 2022
Sold by
Anna Alberdi
Bought by
Level Up Investments Llc
Current Estimated Value
Purchase Details
Closed on
Jul 10, 2019
Sold by
Urrizaga Evelyn E and Byrnes Evelyn
Bought by
Alberdi Anna and Bush Grace
Purchase Details
Closed on
May 20, 2005
Sold by
Milanez Rudy and Milanez Virginia
Bought by
Urrizaga Evelyn E
Home Financials for this Owner
Home Financials are based on the most recent Mortgage that was taken out on this home.
Original Mortgage
$71,900
Interest Rate
5.74%
Mortgage Type
New Conventional
Purchase Details
Closed on
May 10, 2005
Sold by
Milanez Libra Do
Bought by
Milanez Virginia
Home Financials for this Owner
Home Financials are based on the most recent Mortgage that was taken out on this home.
Original Mortgage
$71,900
Interest Rate
5.74%
Mortgage Type
New Conventional
Create a Home Valuation Report for This Property
The Home Valuation Report is an in-depth analysis detailing your home's value as well as a comparison with similar homes in the area
Purchase History
| Date | Buyer | Sale Price | Title Company |
|---|---|---|---|
| Level Up Investments Llc | $150,000 | Wfg National Title | |
| Alberdi Anna | -- | None Available | |
| Urrizaga Evelyn E | $89,900 | Stewart Title Of Northeaster | |
| Milanez Virginia | $89,900 | Stewart Title Co |
Source: Public Records
Mortgage History
| Date | Status | Borrower | Loan Amount |
|---|---|---|---|
| Previous Owner | Urrizaga Evelyn E | $71,900 | |
| Previous Owner | Milanez Virginia | $18,000 | |
| Closed | Level Up Investments Llc | $0 |
Source: Public Records
Tax History
| Year | Tax Paid | Tax Assessment Tax Assessment Total Assessment is a certain percentage of the fair market value that is determined by local assessors to be the total taxable value of land and additions on the property. | Land | Improvement |
|---|---|---|---|---|
| 2025 | $747 | $26,884 | $11,200 | $15,684 |
| 2024 | $747 | $20,639 | $4,725 | $15,914 |
| 2023 | $653 | $19,292 | $4,725 | $14,567 |
| 2022 | $562 | $15,784 | $4,725 | $11,059 |
| 2021 | $520 | $15,261 | $4,725 | $10,536 |
| 2020 | $505 | $15,150 | $4,725 | $10,425 |
| 2019 | $490 | $14,530 | $4,725 | $9,805 |
| 2018 | $475 | $14,399 | $4,725 | $9,674 |
| 2017 | $462 | $14,113 | $4,725 | $9,388 |
| 2016 | $448 | $13,754 | $4,725 | $9,029 |
| 2015 | $434 | $13,471 | $4,725 | $8,746 |
| 2014 | $422 | $12,957 | $4,725 | $8,232 |
Source: Public Records
Map
Nearby Homes
- 559 Ash St Unit 12
- 555 Ash St Unit 6
- 551 Ash St Unit 11
- 547 Ash St Unit 5
- 543 Ash St Unit 10
- 539 Ash St Unit 4
- 535 Ash St Unit 9
- 531 Ash St Unit 3
- 527 Ash St Unit 8
- 523 Ash St Unit 2
- 519 Ash St Unit 7
- 515 Ash St Unit 1
- Country Rd Unit Mountain Meadows Ran
- 390 Ash St
- 452 Walnut St
- 072006013 Walnut St
- 0 7th St
- 9559 7th St
- 33-3 7th St
- 33-2 7th St
Your Personal Tour Guide
Ask me questions while you tour the home.