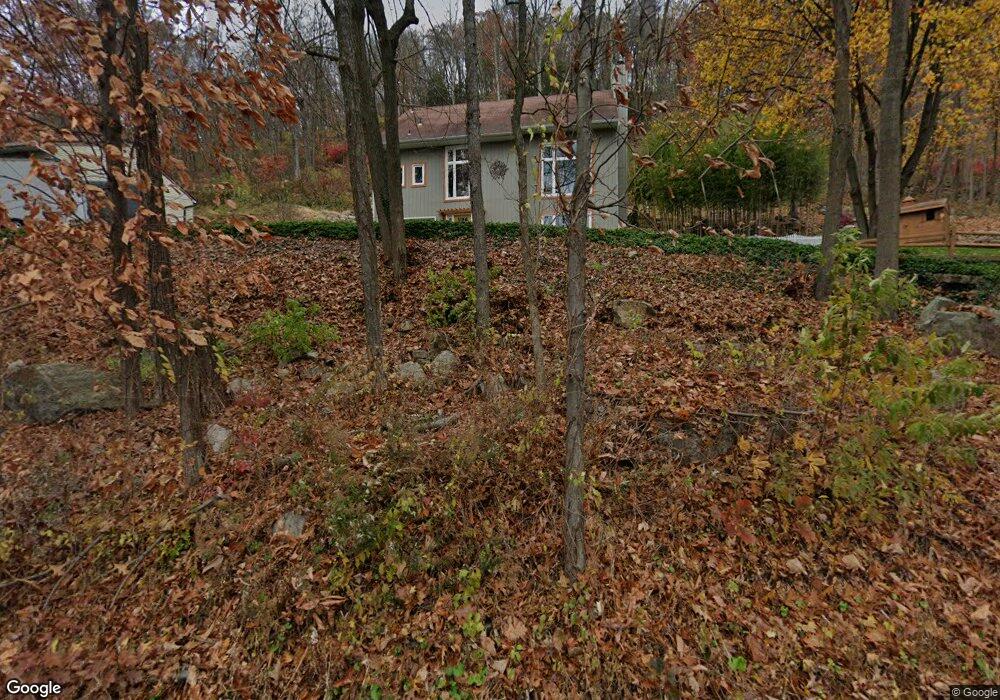
569 Berkshire Valley Rd Wharton, NJ 07885
Estimated Value: $478,000 - $496,000
--
Bed
--
Bath
1,701
Sq Ft
$287/Sq Ft
Est. Value
About This Home
This home is located at 569 Berkshire Valley Rd, Wharton, NJ 07885 and is currently estimated at $487,936, approximately $286 per square foot. 569 Berkshire Valley Rd is a home located in Morris County with nearby schools including Jefferson Township Middle School and Jefferson Township High School.
Ownership History
Date
Name
Owned For
Owner Type
Purchase Details
Closed on
Feb 23, 2022
Sold by
Ernest Bock Iii
Bought by
Bock Ernest
Current Estimated Value
Home Financials for this Owner
Home Financials are based on the most recent Mortgage that was taken out on this home.
Original Mortgage
$239,400
Interest Rate
3.15%
Mortgage Type
New Conventional
Purchase Details
Closed on
May 22, 2014
Sold by
Bock Ernest and Bock Casey
Bought by
Bock Ernest
Home Financials for this Owner
Home Financials are based on the most recent Mortgage that was taken out on this home.
Original Mortgage
$283,500
Interest Rate
4.18%
Mortgage Type
New Conventional
Purchase Details
Closed on
Nov 4, 2005
Sold by
Treacy Brian P
Bought by
Bock Ernest and Bock Casey
Home Financials for this Owner
Home Financials are based on the most recent Mortgage that was taken out on this home.
Original Mortgage
$313,600
Interest Rate
6.07%
Mortgage Type
New Conventional
Create a Home Valuation Report for This Property
The Home Valuation Report is an in-depth analysis detailing your home's value as well as a comparison with similar homes in the area
Home Values in the Area
Average Home Value in this Area
Purchase History
| Date | Buyer | Sale Price | Title Company |
|---|---|---|---|
| Bock Ernest | -- | None Listed On Document | |
| Bock Ernest | -- | Agent For Stewart Title Guar | |
| Bock Ernest | $392,000 | -- |
Source: Public Records
Mortgage History
| Date | Status | Borrower | Loan Amount |
|---|---|---|---|
| Previous Owner | Bock Ernest | $239,400 | |
| Previous Owner | Bock Ernest | $283,500 | |
| Previous Owner | Bock Ernest | $313,600 |
Source: Public Records
Tax History Compared to Growth
Tax History
| Year | Tax Paid | Tax Assessment Tax Assessment Total Assessment is a certain percentage of the fair market value that is determined by local assessors to be the total taxable value of land and additions on the property. | Land | Improvement |
|---|---|---|---|---|
| 2025 | $10,405 | $346,600 | $136,200 | $210,400 |
| 2024 | $10,142 | $346,600 | $136,200 | $210,400 |
| 2023 | $10,142 | $346,600 | $136,200 | $210,400 |
| 2022 | $9,684 | $346,600 | $136,200 | $210,400 |
| 2021 | $9,684 | $346,600 | $136,200 | $210,400 |
| 2020 | $9,521 | $346,600 | $136,200 | $210,400 |
| 2019 | $9,281 | $337,600 | $135,000 | $202,600 |
| 2018 | $9,139 | $327,800 | $130,200 | $197,600 |
| 2017 | $8,988 | $316,700 | $128,600 | $188,100 |
| 2016 | $8,607 | $320,100 | $128,600 | $191,500 |
| 2015 | $8,372 | $304,100 | $128,600 | $175,500 |
| 2014 | $8,349 | $306,600 | $128,600 | $178,000 |
Source: Public Records
Map
Nearby Homes
- 347 Berkshire Valley Rd
- 55 Taylor Rd
- 692 Skyline Dr
- 56 Minnisink Rd
- 24 Southard Rd
- 15 River Rd (Aka Larry Rd)
- 52 W Union Turnpike
- 833 Berkshire Valley Rd
- 15 River Rd
- 22145 Westview
- 72 Langdon Ave
- 18116 Westview Unit 116E
- 18116 Westview
- 13 Stonehenge Rd
- 0 Ackerman Unit 3950182
- 399 N Main St
- 19123 Westview Unit 19123
- 40 Playhouse Park
- 69 Mountainview Ave
- 322 Richard Mine Rd Unit 2
- 551 Berkshire Valley Rd
- 556 Berkshire Valley Rd
- 552 Berkshire Valley Rd
- 548 Berkshire Valley Rd
- 560 Berkshire Valley Rd
- 562 Berkshire Valley Rd
- 542 Berkshire Valley Rd
- 540 Berkshire Valley Rd
- 566 Berkshire Valley Rd
- 538 Berkshire Valley Rd
- 570 Berkshire Valley Rd
- 536 Berkshire Valley Rd
- 589 Berkshire Valley Rd
- 574 Berkshire Valley Rd
- 578 Berkshire Valley Rd
- 597 Berkshire Valley Rd
- 599 Berkshire Valley Rd
- 541 Berkshire Valley Rd
- 584 Berkshire Valley Rd
- 603 Berkshire Valley Rd