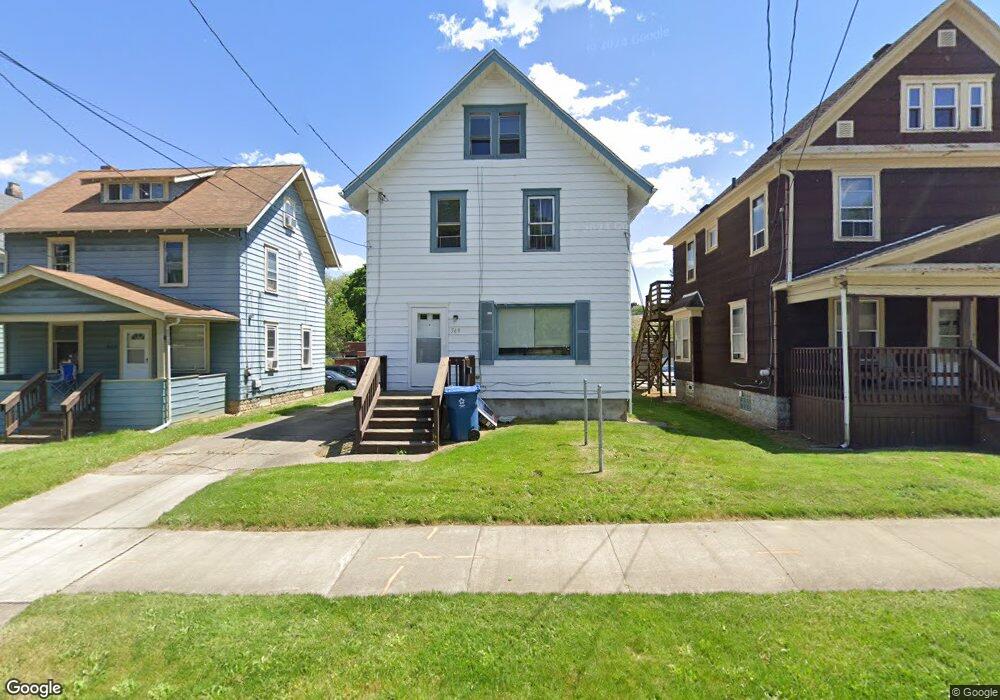
569 Brown St Akron, OH 44311
Downtown Akron NeighborhoodEstimated Value: $108,000 - $135,000
5
Beds
2
Baths
1,540
Sq Ft
$76/Sq Ft
Est. Value
About This Home
This home is located at 569 Brown St, Akron, OH 44311 and is currently estimated at $116,518, approximately $75 per square foot. 569 Brown St is a home located in Summit County with nearby schools including North High School, Main Preparatory Academy, and St. Bernard-St. Mary Elementary School.
Ownership History
Date
Name
Owned For
Owner Type
Purchase Details
Closed on
Mar 23, 2017
Sold by
Westfall G Matthew
Bought by
Westfall Westfall G and Westfall Teri L
Current Estimated Value
Home Financials for this Owner
Home Financials are based on the most recent Mortgage that was taken out on this home.
Original Mortgage
$630,000
Outstanding Balance
$522,430
Interest Rate
4.17%
Mortgage Type
Commercial
Estimated Equity
-$405,912
Purchase Details
Closed on
Jul 30, 1997
Sold by
Westfall Denby A
Bought by
Westfall G Matthew
Create a Home Valuation Report for This Property
The Home Valuation Report is an in-depth analysis detailing your home's value as well as a comparison with similar homes in the area
Home Values in the Area
Average Home Value in this Area
Purchase History
| Date | Buyer | Sale Price | Title Company |
|---|---|---|---|
| Westfall Westfall G | -- | None Available | |
| Westfall G Matthew | $10,000 | -- |
Source: Public Records
Mortgage History
| Date | Status | Borrower | Loan Amount |
|---|---|---|---|
| Open | Westfall Westfall G | $630,000 |
Source: Public Records
Tax History Compared to Growth
Tax History
| Year | Tax Paid | Tax Assessment Tax Assessment Total Assessment is a certain percentage of the fair market value that is determined by local assessors to be the total taxable value of land and additions on the property. | Land | Improvement |
|---|---|---|---|---|
| 2025 | $1,839 | $33,167 | $6,871 | $26,296 |
| 2024 | $1,839 | $33,167 | $6,871 | $26,296 |
| 2023 | $1,839 | $33,167 | $6,871 | $26,296 |
| 2022 | $1,610 | $22,645 | $4,550 | $18,095 |
| 2021 | $1,611 | $22,645 | $4,550 | $18,095 |
| 2020 | $1,588 | $22,650 | $4,550 | $18,100 |
| 2019 | $1,529 | $19,760 | $4,550 | $15,210 |
| 2018 | $1,509 | $19,760 | $4,550 | $15,210 |
| 2017 | $1,362 | $19,760 | $4,550 | $15,210 |
| 2016 | $1,363 | $17,410 | $4,550 | $12,860 |
| 2015 | $1,362 | $17,410 | $4,550 | $12,860 |
| 2014 | $1,352 | $17,410 | $4,550 | $12,860 |
| 2013 | $1,329 | $17,470 | $4,550 | $12,920 |
Source: Public Records
Map
Nearby Homes
- 442 E Thornton St
- 633 Brown St
- 634 Spicer St
- 380 Cross St Unit 382
- 370 E Thornton St
- 495 Beacon St
- 498 Gage St
- 685 Brown St
- 531 Allyn St Unit 533
- 386 E Voris St
- 687 Allyn St
- 628, 634 & 636 Sumner St Unit 6 units
- 319 Sterling Ct
- 403 Spicer St
- 590 and 596 Sumner St
- 298 Sumner Ct
- 397 Spicer St
- 463 Allyn St
- 678 Sumner St Unit 682
- 393 Spicer St