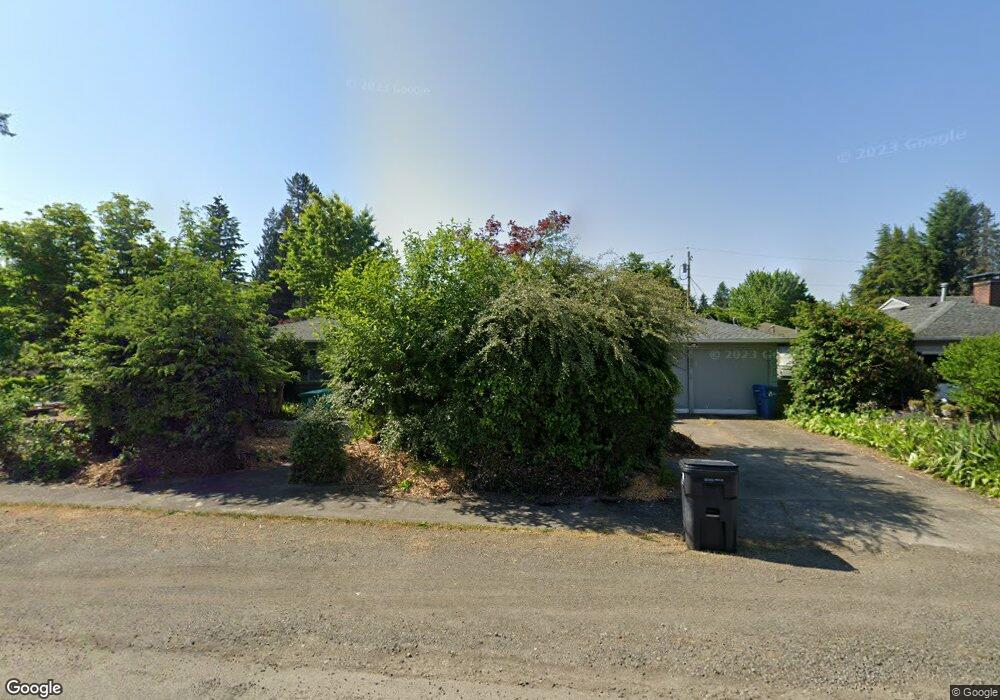
569 Burnaby Ave SE Olympia, WA 98501
Carlyon-North NeighborhoodEstimated Value: $525,000 - $571,000
4
Beds
2
Baths
1,709
Sq Ft
$323/Sq Ft
Est. Value
About This Home
This home is located at 569 Burnaby Ave SE, Olympia, WA 98501 and is currently estimated at $551,823, approximately $322 per square foot. 569 Burnaby Ave SE is a home located in Thurston County with nearby schools including Pioneer Elementary School, Washington Middle School, and Olympia High School.
Ownership History
Date
Name
Owned For
Owner Type
Purchase Details
Closed on
Feb 14, 2020
Sold by
Weisenfeld and Judie
Bought by
Weisenfeld Elizabeth R
Current Estimated Value
Purchase Details
Closed on
Aug 19, 2019
Sold by
Weisenfeld Shirley R
Bought by
Weisenfeld Shirley R and Weisenfeld Mark E
Purchase Details
Closed on
Sep 21, 2001
Sold by
Robinson Donald E and Robinson Jacqueline L
Bought by
Weisenfeld Jack E and Weisenfeld Shirley R
Create a Home Valuation Report for This Property
The Home Valuation Report is an in-depth analysis detailing your home's value as well as a comparison with similar homes in the area
Home Values in the Area
Average Home Value in this Area
Purchase History
| Date | Buyer | Sale Price | Title Company |
|---|---|---|---|
| Weisenfeld Elizabeth R | $24,434 | None Listed On Document | |
| Weisenfeld Shirley R | -- | None Available | |
| Weisenfeld Jack E | -- | Thurston County Title |
Source: Public Records
Tax History Compared to Growth
Tax History
| Year | Tax Paid | Tax Assessment Tax Assessment Total Assessment is a certain percentage of the fair market value that is determined by local assessors to be the total taxable value of land and additions on the property. | Land | Improvement |
|---|---|---|---|---|
| 2024 | $5,258 | $518,500 | $162,700 | $355,800 |
| 2023 | $5,258 | $502,700 | $148,600 | $354,100 |
| 2022 | $5,075 | $519,100 | $124,000 | $395,100 |
| 2021 | $4,552 | $424,700 | $105,900 | $318,800 |
| 2020 | $4,072 | $352,500 | $114,600 | $237,900 |
| 2019 | $376 | $307,600 | $95,800 | $211,800 |
| 2018 | $376 | $310,500 | $80,000 | $230,500 |
| 2017 | $373 | $275,000 | $89,000 | $186,000 |
| 2016 | $374 | $261,900 | $75,500 | $186,400 |
| 2014 | -- | $261,050 | $78,850 | $182,200 |
Source: Public Records
Map
Nearby Homes
- 3225 Maringo Rd SE
- 3242 Maringo Rd SE
- 510 North St SE
- 532 Eskridge Way SE
- 3425 Pear St SE
- 509 Bates St SE
- 3509 Hawthorne Place SE
- 2501 Otis St SE
- 2926 Orange St SE
- 1304 Eskridge Blvd SE
- 509 N 3rd Ave SW
- 2937 Lybarger St SE
- 2117 Adams St SE
- 121 S 2nd Ave SW
- 633 Division St SW
- 732 Desoto St SW
- 722 Desoto St SW
- 311 19th Ave SE
- 0 Hansen St SE
- 303 N 6th Ave SW
- 3135 Maringo Rd SE
- 561 Burnaby Ave SE
- 521 Burnaby Ave SE
- 3117 Maringo Rd SE
- 530 Vista Ave SE
- 3126 Maringo Rd SE
- 555 Burnaby Ave SE
- 510 Vista Ave SE
- 500 Vista Ave SE
- 3136 Maringo Rd SE
- 538 Burnaby Ave SE
- 530 Burnaby Ave SE
- 3116 Maringo Rd SE
- 3140 Maringo Rd SE
- 434 Vista Ave SE
- 524 Burnaby Ave SE
- 515 Vista St SE
- 515 Vista Ave SE
- 3105 Maringo Rd SE
- 517 Carlyon Ave SE