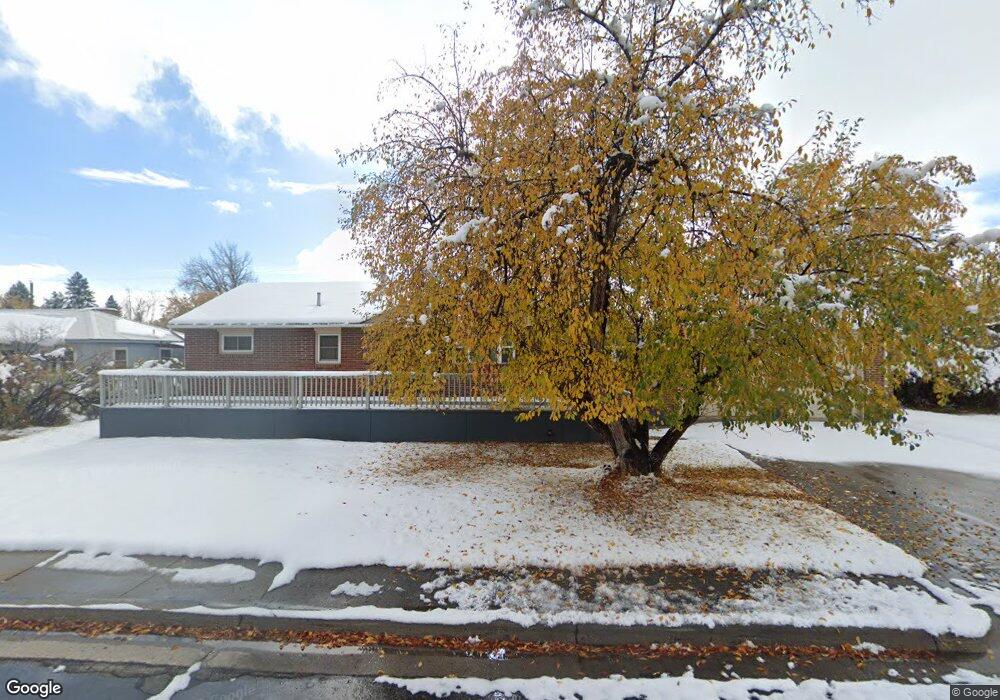
569 Cascade St Lander, WY 82520
Estimated Value: $413,000 - $455,000
3
Beds
2
Baths
1,830
Sq Ft
$235/Sq Ft
Est. Value
About This Home
This home is located at 569 Cascade St, Lander, WY 82520 and is currently estimated at $430,430, approximately $235 per square foot. 569 Cascade St is a home located in Fremont County with nearby schools including Lander Valley High School and Lander Christian Academy.
Ownership History
Date
Name
Owned For
Owner Type
Purchase Details
Closed on
Sep 30, 2024
Sold by
Rummel Jonathan E and Rummel Deanna L
Bought by
Komsthoeft Alexandra and Phares Robert
Current Estimated Value
Purchase Details
Closed on
Jun 4, 2007
Sold by
Holmes Joseph L and Holmes Amy
Bought by
Susanka Joseph and Susanka Sarah
Home Financials for this Owner
Home Financials are based on the most recent Mortgage that was taken out on this home.
Original Mortgage
$197,600
Interest Rate
6.16%
Mortgage Type
New Conventional
Purchase Details
Closed on
Jun 28, 2006
Sold by
Contilogue Norma L
Bought by
Holmes Joseph L and Holmes Amy L
Home Financials for this Owner
Home Financials are based on the most recent Mortgage that was taken out on this home.
Original Mortgage
$38,000
Interest Rate
6.58%
Mortgage Type
Balloon
Create a Home Valuation Report for This Property
The Home Valuation Report is an in-depth analysis detailing your home's value as well as a comparison with similar homes in the area
Home Values in the Area
Average Home Value in this Area
Purchase History
| Date | Buyer | Sale Price | Title Company |
|---|---|---|---|
| Komsthoeft Alexandra | -- | None Listed On Document | |
| Susanka Joseph | -- | None Available | |
| Holmes Joseph L | -- | None Available |
Source: Public Records
Mortgage History
| Date | Status | Borrower | Loan Amount |
|---|---|---|---|
| Previous Owner | Susanka Joseph | $197,600 | |
| Previous Owner | Holmes Joseph L | $38,000 |
Source: Public Records
Tax History
| Year | Tax Paid | Tax Assessment Tax Assessment Total Assessment is a certain percentage of the fair market value that is determined by local assessors to be the total taxable value of land and additions on the property. | Land | Improvement |
|---|---|---|---|---|
| 2025 | $2,904 | $29,172 | $4,377 | $24,795 |
| 2024 | $2,904 | $37,624 | $5,835 | $31,789 |
| 2023 | $2,746 | $35,861 | $5,295 | $30,566 |
| 2022 | $2,328 | $31,075 | $5,295 | $25,780 |
| 2021 | $2,076 | $26,822 | $5,092 | $21,730 |
| 2020 | $1,995 | $25,826 | $5,092 | $20,734 |
| 2019 | $1,979 | $25,208 | $5,092 | $20,116 |
| 2018 | $1,927 | $24,275 | $5,092 | $19,183 |
| 2017 | $1,887 | $23,718 | $5,092 | $18,626 |
| 2016 | $1,856 | $23,365 | $5,092 | $18,273 |
| 2015 | $1,806 | $22,989 | $5,092 | $17,897 |
| 2014 | $1,638 | $20,883 | $5,092 | $15,791 |
Source: Public Records
Map
Nearby Homes
- 581 Cascade St
- 580 Cascade St
- 555 Cascade St
- 590 Cascade St
- 566 Cascade St
- 566 Cascade St Unit South 5th
- 528 Cascade St
- 528 Cascade St Unit South 5th
- 543 Cascade St
- 566 Shoshone St
- 566 Shoshone St Unit S. 5th
- 600 Cascade St
- 550 Shoshone St
- 612 Cascade St
- 723 S 5th St
- 569 W Brodie St
- 577 W Brodie St
- 545 W Brodie St
- 586 Shoshone St
- 500 Cascade St
Your Personal Tour Guide
Ask me questions while you tour the home.