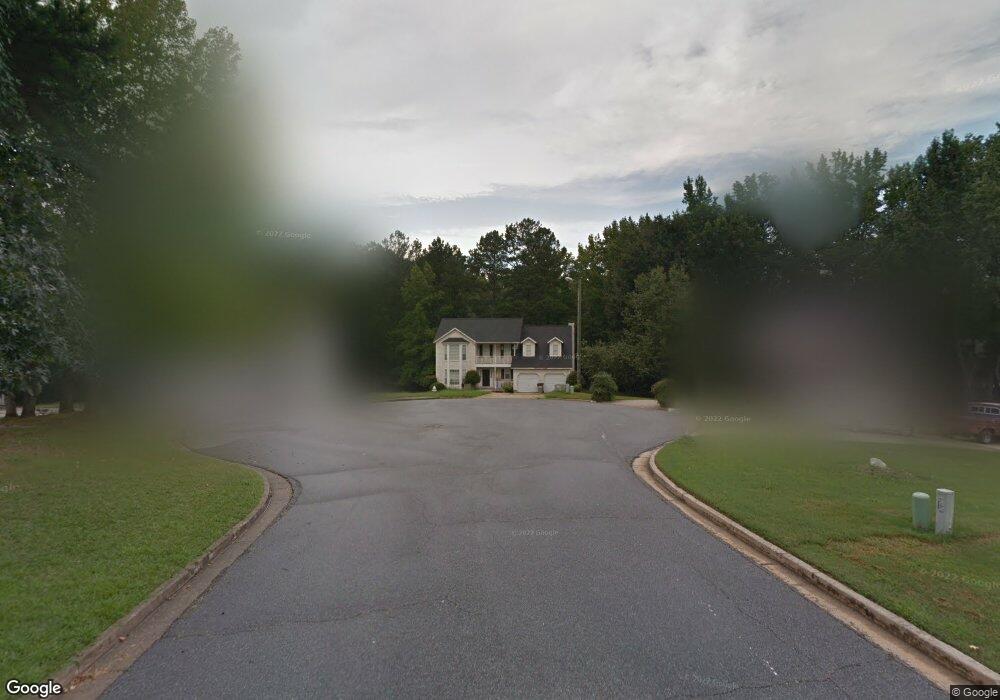
569 Crossing Ct Unit II Jonesboro, GA 30238
Estimated Value: $241,000 - $271,000
4
Beds
3
Baths
2,094
Sq Ft
$120/Sq Ft
Est. Value
About This Home
This home is located at 569 Crossing Ct Unit II, Jonesboro, GA 30238 and is currently estimated at $251,836, approximately $120 per square foot. 569 Crossing Ct Unit II is a home located in Clayton County with nearby schools including Kemp Primary School, Kemp Elementary School, and Mundys Mill Middle School.
Ownership History
Date
Name
Owned For
Owner Type
Purchase Details
Closed on
May 18, 2025
Sold by
Jones Mark D
Bought by
Allen Latissa S
Current Estimated Value
Purchase Details
Closed on
Jul 19, 2002
Sold by
Sr Larry L
Bought by
Jones Mark and Jones Latissa
Home Financials for this Owner
Home Financials are based on the most recent Mortgage that was taken out on this home.
Original Mortgage
$121,250
Interest Rate
6.52%
Mortgage Type
New Conventional
Purchase Details
Closed on
May 3, 2002
Sold by
Mitchell Sheila K
Bought by
Lanier Larry L
Create a Home Valuation Report for This Property
The Home Valuation Report is an in-depth analysis detailing your home's value as well as a comparison with similar homes in the area
Home Values in the Area
Average Home Value in this Area
Purchase History
| Date | Buyer | Sale Price | Title Company |
|---|---|---|---|
| Allen Latissa S | -- | -- | |
| Jones Mark | $125,000 | -- | |
| Lanier Larry L | $10,800 | -- |
Source: Public Records
Mortgage History
| Date | Status | Borrower | Loan Amount |
|---|---|---|---|
| Previous Owner | Jones Mark | $121,250 |
Source: Public Records
Tax History Compared to Growth
Tax History
| Year | Tax Paid | Tax Assessment Tax Assessment Total Assessment is a certain percentage of the fair market value that is determined by local assessors to be the total taxable value of land and additions on the property. | Land | Improvement |
|---|---|---|---|---|
| 2024 | $3,558 | $100,000 | $7,200 | $92,800 |
| 2023 | $2,689 | $101,160 | $7,200 | $93,960 |
| 2022 | $2,827 | $80,840 | $7,200 | $73,640 |
| 2021 | $2,087 | $61,640 | $7,200 | $54,440 |
| 2020 | $1,978 | $58,287 | $7,200 | $51,087 |
| 2019 | $1,748 | $51,904 | $5,600 | $46,304 |
| 2018 | $1,658 | $49,687 | $5,600 | $44,087 |
| 2017 | $1,205 | $38,448 | $5,600 | $32,848 |
| 2016 | $1,220 | $38,821 | $5,600 | $33,221 |
| 2015 | $1,200 | $0 | $0 | $0 |
| 2014 | $896 | $31,317 | $5,600 | $25,717 |
Source: Public Records
Map
Nearby Homes
- 9409 Forest Knoll Dr
- 9383 Woodknoll Way Unit 4
- 725 River Mist Dr
- 9556 Thomas Downs Ln Unit 1
- 9404 Cypress Ln
- 9342 Thomas Rd
- 255 Olde Oak Dr
- 9404 Bogey Ct
- 301 Deerfield Dr
- 9181 Welch Ct
- 316 River Chase Dr
- 281 Willow Springs Dr
- 288 Country Club Dr
- 22 Fairview Dr
- 296 Country Club Dr
- 556 Country Greens Dr
- 299 Country Club Dr
- 237 Country Club Dr
- 254 Country Club Dr
- 9138 Sunset Dr Unit 3
- 568 Crossing Ct
- 565 Crossing Ct
- 559 Crossing Ct
- 562 Crossing Ct
- 552 Brookfield Way
- 560 Brookfield Way
- 544 Brookfield Way
- 527 Thomas Downs Way
- 551 Crossing Ct
- 566 Brookfield Way
- 536 Brookfield Way
- 521 Thomas Downs Way
- 528 Brookfield Way
- 855 Brookfield Way
- 531 Thomas Downs Way
- 570 Brookfield Way
- 520 Brookfield Way
- 535 Thomas Downs Way
- 517 Thomas Downs Way
- 524 Thomas Downs Way