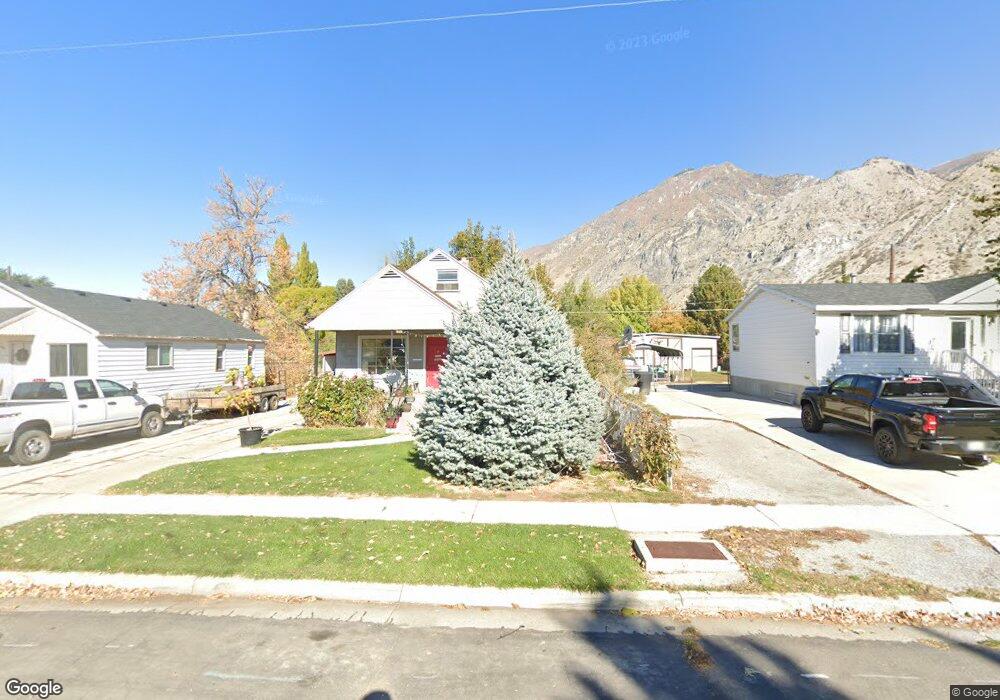
569 E 100 N Springville, UT 84663
Estimated Value: $498,000 - $533,000
5
Beds
2
Baths
1,412
Sq Ft
$367/Sq Ft
Est. Value
About This Home
This home is located at 569 E 100 N, Springville, UT 84663 and is currently estimated at $518,729, approximately $367 per square foot. 569 E 100 N is a home located in Utah County with nearby schools including Art City School, Springville Junior High School, and Springville High School.
Ownership History
Date
Name
Owned For
Owner Type
Purchase Details
Closed on
Dec 3, 2021
Sold by
Gabbitas Gary K and Simkins Vickie Gabbitas
Bought by
Simkins Philip H and Simkins Vickie L
Current Estimated Value
Home Financials for this Owner
Home Financials are based on the most recent Mortgage that was taken out on this home.
Original Mortgage
$594,000
Outstanding Balance
$248,798
Interest Rate
2.1%
Mortgage Type
Reverse Mortgage Home Equity Conversion Mortgage
Estimated Equity
$269,931
Create a Home Valuation Report for This Property
The Home Valuation Report is an in-depth analysis detailing your home's value as well as a comparison with similar homes in the area
Home Values in the Area
Average Home Value in this Area
Purchase History
| Date | Buyer | Sale Price | Title Company |
|---|---|---|---|
| Simkins Philip H | -- | Gt Title Services |
Source: Public Records
Mortgage History
| Date | Status | Borrower | Loan Amount |
|---|---|---|---|
| Open | Simkins Philip H | $594,000 | |
| Closed | Simkins Philip H | $594,000 |
Source: Public Records
Tax History
| Year | Tax Paid | Tax Assessment Tax Assessment Total Assessment is a certain percentage of the fair market value that is determined by local assessors to be the total taxable value of land and additions on the property. | Land | Improvement |
|---|---|---|---|---|
| 2025 | $2,302 | $257,895 | -- | -- |
| 2024 | $2,259 | $235,785 | $0 | $0 |
| 2023 | $2,259 | $231,660 | $0 | $0 |
| 2022 | $2,285 | $230,120 | $0 | $0 |
| 2021 | $2,023 | $317,100 | $124,300 | $192,800 |
| 2020 | $1,813 | $275,500 | $92,100 | $183,400 |
| 2019 | $1,667 | $257,900 | $76,700 | $181,200 |
| 2018 | $1,551 | $229,000 | $71,400 | $157,600 |
| 2017 | $1,435 | $112,475 | $0 | $0 |
| 2016 | $1,251 | $96,140 | $0 | $0 |
| 2015 | $1,196 | $93,995 | $0 | $0 |
| 2014 | $1,138 | $88,825 | $0 | $0 |
Source: Public Records
Map
Nearby Homes
Your Personal Tour Guide
Ask me questions while you tour the home.