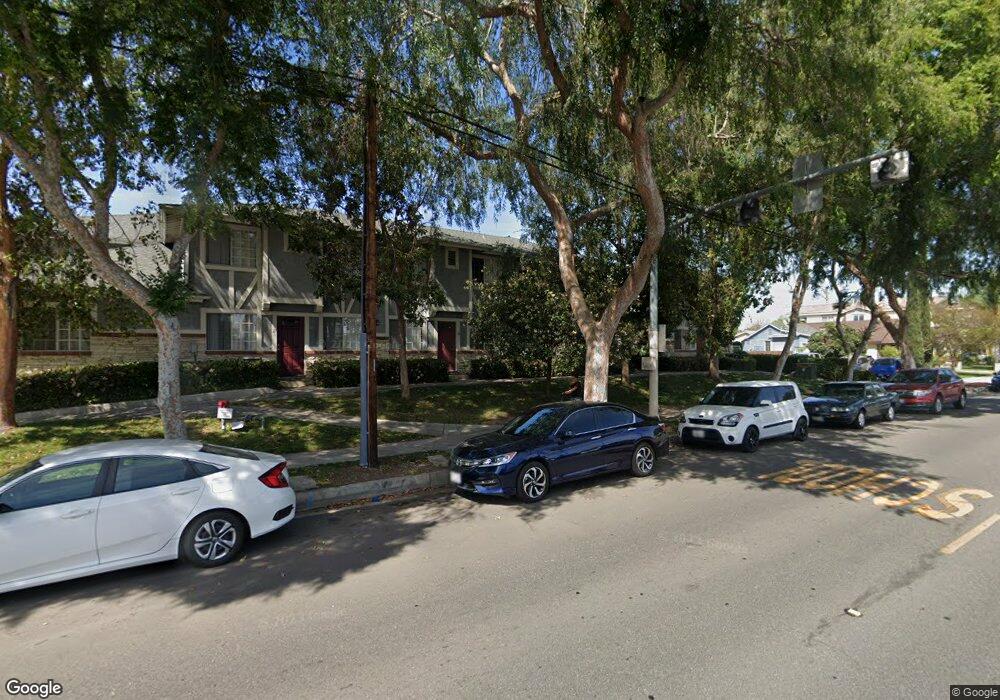
569 E 11th St Upland, CA 91786
2
Beds
--
Bath
850
Sq Ft
--
Built
About This Home
This home is located at 569 E 11th St, Upland, CA 91786. 569 E 11th St is a home located in San Bernardino County with nearby schools including Upland Elementary School, Upland Junior High School, and Upland High School.
Create a Home Valuation Report for This Property
The Home Valuation Report is an in-depth analysis detailing your home's value as well as a comparison with similar homes in the area
Home Values in the Area
Average Home Value in this Area
Property History
We collect this data history from publicly available records. To have your information removed, we recommend requesting removal directly through your county’s website.
| Date | Event | Price | List to Sale | Price per Sq Ft |
|---|---|---|---|---|
| 04/08/2025 04/08/25 | Off Market | $1,900 | -- | -- |
| 01/15/2025 01/15/25 | Price Changed | $1,900 | -5.0% | $2 / Sq Ft |
| 10/17/2024 10/17/24 | Price Changed | $2,000 | -4.8% | $2 / Sq Ft |
| 09/01/2024 09/01/24 | Price Changed | $2,100 | 0.0% | $2 / Sq Ft |
| 09/01/2024 09/01/24 | For Rent | $2,100 | -2.3% | -- |
| 06/13/2024 06/13/24 | Price Changed | $2,150 | +13.2% | $3 / Sq Ft |
| 06/01/2024 06/01/24 | For Rent | -- | -- | -- |
| 02/02/2023 02/02/23 | For Rent | $1,900 | -- | -- |
Tax History
We collect this data history from publicly available records. To have your information removed, we recommend requesting removal directly through your county’s website.
| Year | Tax Paid | Tax Assessment Tax Assessment Total Assessment is a certain percentage of the fair market value that is determined by local assessors to be the total taxable value of land and additions on the property. | Land | Improvement |
|---|---|---|---|---|
| 2025 | $53,609 | $4,961,765 | $1,166,716 | $3,795,049 |
| 2024 | $51,904 | $4,864,475 | $1,143,839 | $3,720,636 |
| 2023 | $51,145 | $4,769,093 | $1,121,411 | $3,647,682 |
| 2022 | $50,055 | $4,675,582 | $1,099,423 | $3,576,159 |
| 2021 | $50,038 | $4,583,904 | $1,077,866 | $3,506,038 |
| 2020 | $48,683 | $4,536,902 | $1,066,814 | $3,470,088 |
| 2019 | $48,513 | $4,447,943 | $1,045,896 | $3,402,047 |
| 2018 | $47,298 | $4,360,728 | $1,025,388 | $3,335,340 |
| 2017 | $45,937 | $4,275,223 | $1,005,282 | $3,269,941 |
| 2016 | $39,962 | $3,713,200 | $547,100 | $3,166,100 |
| 2015 | $37,759 | $3,536,300 | $521,000 | $3,015,300 |
| 2014 | $37,522 | $3,536,300 | $521,000 | $3,015,300 |
Source: Public Records
Map
Nearby Homes
- 506 E 11th St
- 585 N 8th Ave
- 519 N 8th Ave
- 572 West St
- 505 N 8th Ave
- 511 D St
- 351 West St
- 365 N 6th Ave
- 1191 N 3rd Ave
- 840 N Euclid Ave
- 929 E Foothill Blvd Unit 52
- 929 E Foothill Blvd
- 929 E Foothill Blvd Unit 91
- 929 E Foothill Blvd Unit 155
- 929 E Foothill Blvd Unit 118
- 929 E Foothill Blvd Unit 144
- 929 E Foothill Blvd Unit 190
- 929 E Foothill Blvd Unit 198
- 691 N Euclid Ave
- 249 N 10th Ave
Your Personal Tour Guide
Ask me questions while you tour the home.