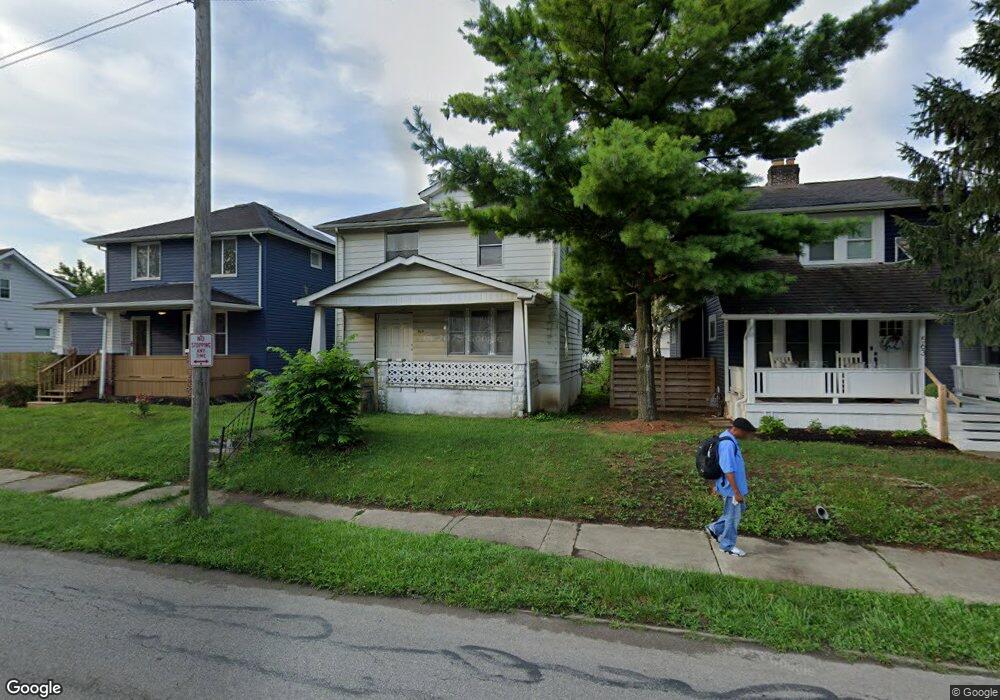
569 Frebis Ave Columbus, OH 43206
Vassor Village NeighborhoodEstimated Value: $170,000 - $215,000
3
Beds
1
Bath
1,152
Sq Ft
$160/Sq Ft
Est. Value
About This Home
This home is located at 569 Frebis Ave, Columbus, OH 43206 and is currently estimated at $183,845, approximately $159 per square foot. 569 Frebis Ave is a home located in Franklin County with nearby schools including Lincoln Park Elementary School, South High School, and South Columbus Preparatory Academy.
Ownership History
Date
Name
Owned For
Owner Type
Purchase Details
Closed on
Aug 30, 2006
Sold by
Bielanski Garry J and Turner Jeffrey T
Bought by
Mobley Andrew J
Current Estimated Value
Home Financials for this Owner
Home Financials are based on the most recent Mortgage that was taken out on this home.
Original Mortgage
$51,110
Outstanding Balance
$30,860
Interest Rate
6.77%
Mortgage Type
Purchase Money Mortgage
Estimated Equity
$152,985
Purchase Details
Closed on
Aug 15, 2002
Sold by
Turner & Joseph Inc
Bought by
Bielanski Garry J and Turner Jeffrey T
Home Financials for this Owner
Home Financials are based on the most recent Mortgage that was taken out on this home.
Original Mortgage
$147,000
Interest Rate
6.56%
Mortgage Type
Purchase Money Mortgage
Purchase Details
Closed on
Nov 24, 2001
Sold by
Sec Of Hud
Bought by
Turner & Joseph Inc
Home Financials for this Owner
Home Financials are based on the most recent Mortgage that was taken out on this home.
Original Mortgage
$40,000
Interest Rate
6.68%
Purchase Details
Closed on
Jan 21, 1999
Sold by
Crawford Belinda R and Nationsbanc Mtg Corp
Bought by
Hud
Purchase Details
Closed on
Nov 8, 1993
Bought by
Crawford Belinda R
Purchase Details
Closed on
Mar 1, 1986
Purchase Details
Closed on
Feb 1, 1986
Create a Home Valuation Report for This Property
The Home Valuation Report is an in-depth analysis detailing your home's value as well as a comparison with similar homes in the area
Home Values in the Area
Average Home Value in this Area
Purchase History
| Date | Buyer | Sale Price | Title Company |
|---|---|---|---|
| Mobley Andrew J | $53,800 | None Available | |
| Bielanski Garry J | -- | Contract Processing & Title | |
| Turner & Joseph Inc | $31,500 | Contract Processing & Title | |
| Hud | $35,000 | -- | |
| Crawford Belinda R | $49,000 | -- | |
| -- | $33,900 | -- | |
| -- | $23,500 | -- |
Source: Public Records
Mortgage History
| Date | Status | Borrower | Loan Amount |
|---|---|---|---|
| Open | Mobley Andrew J | $51,110 | |
| Previous Owner | Bielanski Garry J | $147,000 | |
| Previous Owner | Turner & Joseph Inc | $40,000 |
Source: Public Records
Tax History Compared to Growth
Tax History
| Year | Tax Paid | Tax Assessment Tax Assessment Total Assessment is a certain percentage of the fair market value that is determined by local assessors to be the total taxable value of land and additions on the property. | Land | Improvement |
|---|---|---|---|---|
| 2024 | $2,420 | $49,630 | $18,760 | $30,870 |
| 2023 | $2,675 | $49,630 | $18,760 | $30,870 |
| 2022 | $5,217 | $15,720 | $4,590 | $11,130 |
| 2021 | $3,319 | $15,720 | $4,590 | $11,130 |
| 2020 | $3,189 | $15,720 | $4,590 | $11,130 |
| 2019 | $970 | $12,260 | $3,820 | $8,440 |
| 2018 | $911 | $12,260 | $3,820 | $8,440 |
| 2017 | $903 | $12,260 | $3,820 | $8,440 |
| 2016 | $2,563 | $12,850 | $3,570 | $9,280 |
| 2015 | $919 | $12,850 | $3,570 | $9,280 |
| 2014 | $775 | $12,850 | $3,570 | $9,280 |
| 2013 | $612 | $13,510 | $3,745 | $9,765 |
Source: Public Records
Map
Nearby Homes
- 563 Frebis Ave
- 530 E Moler St
- 546 Frebis Ave
- 601 Frebis Ave
- 605 Frebis Ave
- 609 Frebis Ave
- 523 Hanford St
- 554 Hanford St
- 484 Sheldon Ave
- 533 E Jenkins Ave
- 656 Sheldon Ave
- 676 E Moler St
- 552 Southwood Ave
- 621-627 E Gates St
- 570 Southwood Ave
- 508-510 Southwood Ave
- 486 & 488 Southwood Ave
- 1274 Wager St
- 531 Southwood Ave
- 565 E Mithoff St
- 559 Frebis Ave
- 583 Frebis Ave
- 555 Frebis Ave
- 568 E Moler St
- 572 E Moler St
- 564 E Moler St
- 587 Frebis Ave Unit 591
- 558 E Moler St
- 576 E Moler St
- 591 Frebis Ave
- 580 E Moler St
- 554 E Moler St
- 572 Frebis Ave
- 568 Frebis Ave
- 576 Frebis Ave
- 564 Frebis Ave
- 580 Frebis Ave
- 584 E Moler St
- 543 Frebis Ave
- 560 Frebis Ave