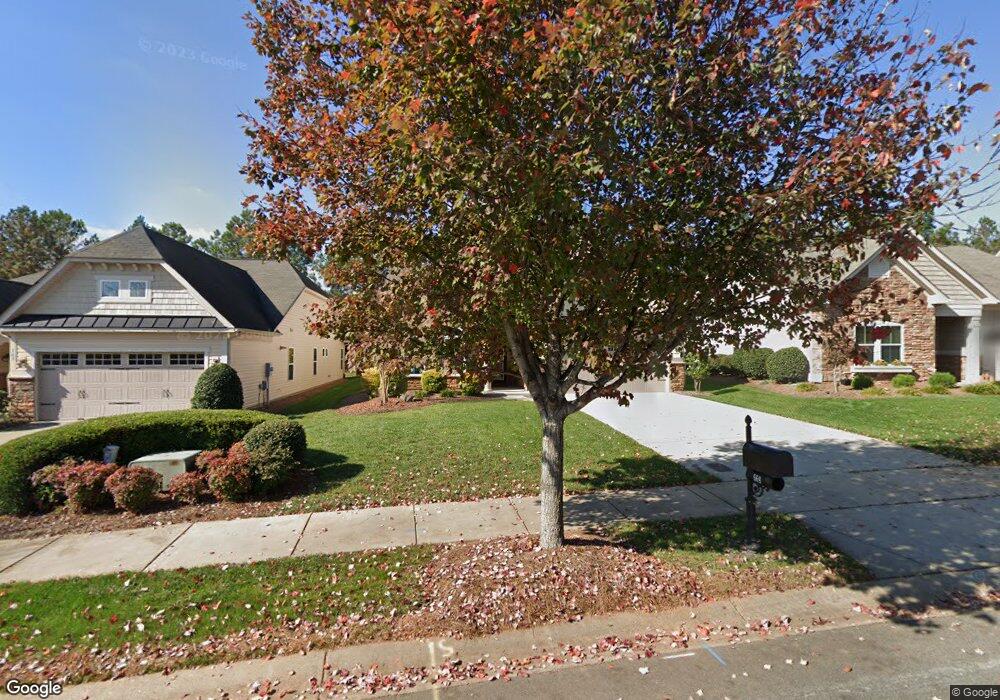
569 Harrison Dr NW Concord, NC 28027
Estimated Value: $430,000 - $463,000
2
Beds
2
Baths
1,856
Sq Ft
$242/Sq Ft
Est. Value
About This Home
This home is located at 569 Harrison Dr NW, Concord, NC 28027 and is currently estimated at $449,547, approximately $242 per square foot. 569 Harrison Dr NW is a home located in Cabarrus County with nearby schools including Weddington Hills Elementary School, Harold E. Winkler Middle School, and Dogwood Classical Academy.
Ownership History
Date
Name
Owned For
Owner Type
Purchase Details
Closed on
Nov 6, 2024
Sold by
Vroom Neil S and Vroom Sandra J
Bought by
Vroom Neil S and Vroom Sandra J
Current Estimated Value
Home Financials for this Owner
Home Financials are based on the most recent Mortgage that was taken out on this home.
Original Mortgage
$645,000
Outstanding Balance
$559,812
Interest Rate
7.5%
Mortgage Type
Reverse Mortgage Home Equity Conversion Mortgage
Estimated Equity
-$110,265
Purchase Details
Closed on
Jul 14, 2020
Sold by
Chiu May F
Bought by
Vroom Neil and Vroom Sandra
Purchase Details
Closed on
Oct 4, 2011
Sold by
Nvr Inc
Bought by
Chiu May F and Matthews Brian L
Purchase Details
Closed on
Aug 2, 2011
Sold by
Glp Partners Llc
Bought by
Nvr Inc
Purchase Details
Closed on
Nov 25, 2008
Sold by
Niblock Development Corp
Bought by
Glp Partners Llc
Create a Home Valuation Report for This Property
The Home Valuation Report is an in-depth analysis detailing your home's value as well as a comparison with similar homes in the area
Home Values in the Area
Average Home Value in this Area
Purchase History
| Date | Buyer | Sale Price | Title Company |
|---|---|---|---|
| Vroom Neil S | -- | None Listed On Document | |
| Vroom Neil | $293,000 | None Available | |
| Chiu May F | $201,000 | None Available | |
| Nvr Inc | $45,500 | None Available | |
| Glp Partners Llc | $3,000,000 | Attorney |
Source: Public Records
Mortgage History
| Date | Status | Borrower | Loan Amount |
|---|---|---|---|
| Open | Vroom Neil S | $645,000 | |
| Closed | Vroom Neil S | $645,000 |
Source: Public Records
Tax History Compared to Growth
Tax History
| Year | Tax Paid | Tax Assessment Tax Assessment Total Assessment is a certain percentage of the fair market value that is determined by local assessors to be the total taxable value of land and additions on the property. | Land | Improvement |
|---|---|---|---|---|
| 2025 | $4,279 | $429,660 | $85,000 | $344,660 |
| 2024 | $4,279 | $429,660 | $85,000 | $344,660 |
| 2023 | $3,442 | $282,140 | $55,000 | $227,140 |
| 2022 | $3,196 | $282,140 | $55,000 | $227,140 |
| 2021 | $3,196 | $282,140 | $55,000 | $227,140 |
| 2020 | $3,196 | $261,950 | $55,000 | $206,950 |
| 2019 | $2,701 | $221,410 | $47,000 | $174,410 |
| 2018 | $2,657 | $221,410 | $47,000 | $174,410 |
| 2017 | $2,613 | $221,410 | $47,000 | $174,410 |
| 2016 | $1,550 | $195,390 | $45,000 | $150,390 |
| 2015 | -- | $195,390 | $45,000 | $150,390 |
| 2014 | -- | $195,390 | $45,000 | $150,390 |
Source: Public Records
Map
Nearby Homes
- 533 Montgrove Place NW
- 2635 Danbury Circle Dr NW
- 542 Buffinton Ct NW
- 518 Wellbourne Ct NW
- 2677 Kinsley Ave NW
- 2676 Sunberry Ln NW
- 2671 Torrington Ln NW
- 2504 Fallbrook Place NW
- 664 Summerford Ct NW
- 557 Keystone Ct NW
- 2695 Jameson Dr NW
- 551 Hemmings Place NW
- 3724 Patricia Dr NW
- 4058 Sagemont Dr NW
- 4909 Charmwood Ct NW
- 4654 Habersham Ct NW
- 1459 Saint Annes Ct NW
- 1246 Greenside Dr NW
- 1252 Giverny Ct NW
- 463 Hunton Forest Dr NW
- 565 Harrison Dr NW
- 573 Harrison Dr NW
- 561 Harrison Dr NW
- 577 Harrison Dr NW
- 557 Harrison Dr NW
- 564 Harrison Dr NW
- 577 Old Speedway Dr NW
- 551 Harrison Dr NW
- 585 Harrison Dr NW
- 2629 Kinsley Ave NW
- 586 Harrison Dr NW
- 547 Harrison Dr NW
- 552 Harrison Dr NW
- 589 Harrison Dr NW
- 575 Old Speedway Dr NW
- 548 Harrison Dr NW
- 543 Harrison Dr NW
- 593 Harrison Dr NW
- 593 Harrison Dr NW Unit 615
- 2646 Ellington St NW