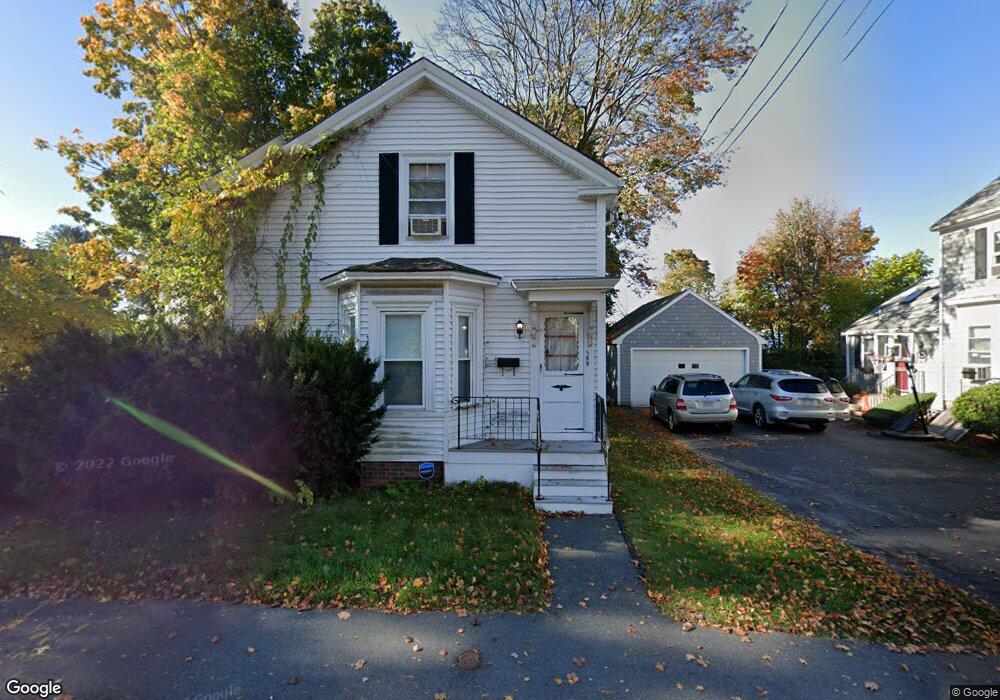
569 Hunnewell St Needham Heights, MA 02494
Estimated Value: $870,124 - $1,105,000
3
Beds
1
Bath
629
Sq Ft
$1,540/Sq Ft
Est. Value
About This Home
This home is located at 569 Hunnewell St, Needham Heights, MA 02494 and is currently estimated at $968,531, approximately $1,539 per square foot. 569 Hunnewell St is a home located in Norfolk County with nearby schools including Eliot Elementary School, High Rock Middle School, and Pollard Middle School.
Ownership History
Date
Name
Owned For
Owner Type
Purchase Details
Closed on
Apr 12, 2000
Sold by
Bonasia Robert F and Bonasia Pamela A
Bought by
Jackson Douglas A
Current Estimated Value
Home Financials for this Owner
Home Financials are based on the most recent Mortgage that was taken out on this home.
Original Mortgage
$149,000
Outstanding Balance
$51,157
Interest Rate
8.26%
Mortgage Type
Purchase Money Mortgage
Estimated Equity
$917,374
Purchase Details
Closed on
May 29, 1991
Sold by
Mcmullen Extr Robert W
Bought by
Piersiak Robert F and Piersiak Jennifer H
Home Financials for this Owner
Home Financials are based on the most recent Mortgage that was taken out on this home.
Original Mortgage
$124,800
Interest Rate
9.35%
Mortgage Type
Purchase Money Mortgage
Create a Home Valuation Report for This Property
The Home Valuation Report is an in-depth analysis detailing your home's value as well as a comparison with similar homes in the area
Home Values in the Area
Average Home Value in this Area
Purchase History
| Date | Buyer | Sale Price | Title Company |
|---|---|---|---|
| Piersiak Robert F | $142,000 | -- | |
| Jackson Douglas A | $279,000 | -- | |
| Piersiak Robert F | $142,000 | -- |
Source: Public Records
Mortgage History
| Date | Status | Borrower | Loan Amount |
|---|---|---|---|
| Open | Piersiak Robert F | $149,000 | |
| Previous Owner | Piersiak Robert F | $148,000 | |
| Previous Owner | Piersiak Robert F | $124,800 |
Source: Public Records
Tax History Compared to Growth
Tax History
| Year | Tax Paid | Tax Assessment Tax Assessment Total Assessment is a certain percentage of the fair market value that is determined by local assessors to be the total taxable value of land and additions on the property. | Land | Improvement |
|---|---|---|---|---|
| 2025 | $7,932 | $748,300 | $626,800 | $121,500 |
| 2024 | $8,067 | $644,300 | $515,000 | $129,300 |
| 2023 | $8,254 | $633,000 | $515,000 | $118,000 |
| 2022 | $7,551 | $564,800 | $451,700 | $113,100 |
| 2021 | $7,359 | $564,800 | $451,700 | $113,100 |
| 2020 | $6,987 | $559,400 | $449,600 | $109,800 |
| 2019 | $6,393 | $516,000 | $408,700 | $107,300 |
| 2018 | $6,130 | $516,000 | $408,700 | $107,300 |
| 2017 | $5,991 | $503,900 | $408,700 | $95,200 |
| 2016 | $5,815 | $503,900 | $408,700 | $95,200 |
| 2015 | $5,689 | $503,900 | $408,700 | $95,200 |
| 2014 | $5,397 | $463,700 | $371,500 | $92,200 |
Source: Public Records
Map
Nearby Homes
- 39 Mark Lee Rd
- 3 Crescent Rd
- 445 Hillside Ave
- 400 Hunnewell St Unit 103
- 379 Hunnewell St Unit 379
- 100 Rosemary Way Unit 129
- 100 Rosemary Way Unit 324
- 556 Webster St
- 7 Avery St
- 36 Davenport Rd
- 35 Andrea Cir
- 34 Pershing Rd
- 143 Hunting Rd
- 9 Jayne Rd
- 62 Evelyn Rd
- 12 Hill St
- 193 Garden St
- 443 Central Ave
- 23 Cheney St
- 41 Lee Rd
- 565 Hunnewell St
- 37 West St
- 37 West St Unit 37
- 39 West St
- 37 West St Unit 2.1
- 45 West St
- 43 West St
- 43 West St
- 43 West St Unit 1
- 51 West St Unit 1
- 51 West St
- 51 West St Unit 51
- 49 West St
- 566 Hunnewell St
- 574 Hunnewell St
- 578 Hunnewell St
- 44 Mark Lee Rd
- 584 Hunnewell St
- 23 West St
- 26 Alfreton Rd Unit 1