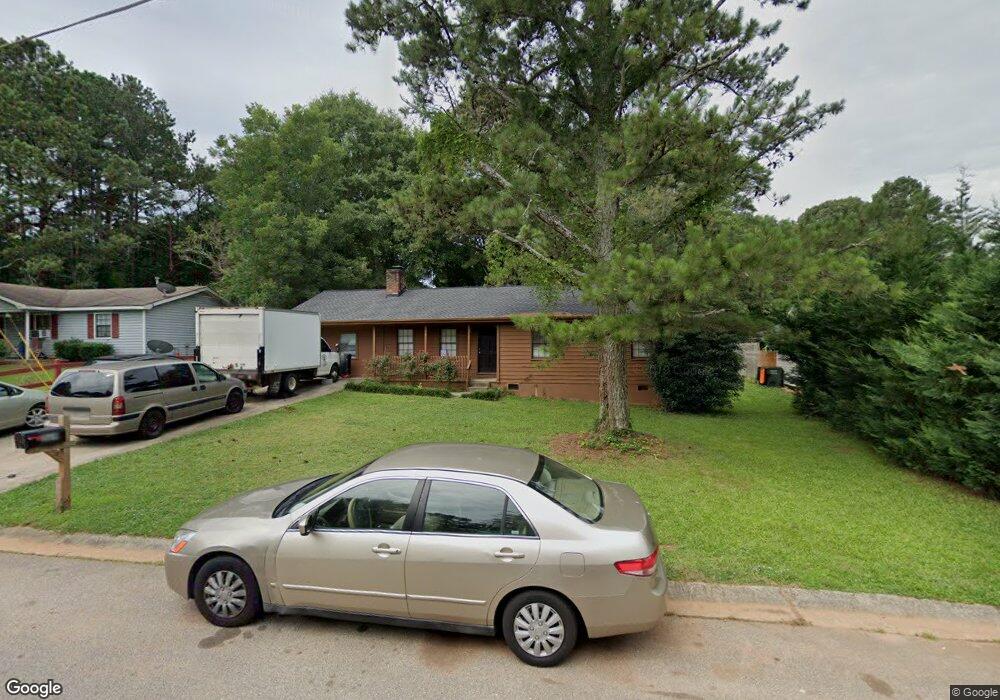
569 Lakeridge Cir SE Unit 569 Conyers, GA 30094
Estimated Value: $232,417 - $246,000
4
Beds
2
Baths
1,352
Sq Ft
$176/Sq Ft
Est. Value
About This Home
This home is located at 569 Lakeridge Cir SE Unit 569, Conyers, GA 30094 and is currently estimated at $237,854, approximately $175 per square foot. 569 Lakeridge Cir SE Unit 569 is a home located in Rockdale County with nearby schools including Honey Creek Elementary School, Edwards Middle School, and Heritage High School.
Ownership History
Date
Name
Owned For
Owner Type
Purchase Details
Closed on
Nov 10, 2023
Sold by
Comfortable Creation Llc
Bought by
Hernandez Jose A Alcala
Current Estimated Value
Home Financials for this Owner
Home Financials are based on the most recent Mortgage that was taken out on this home.
Original Mortgage
$225,834
Outstanding Balance
$221,183
Interest Rate
6.62%
Mortgage Type
FHA
Estimated Equity
$16,671
Purchase Details
Closed on
Feb 27, 2017
Sold by
Lin & Kim Llc
Bought by
Comfortable Creation Llc
Purchase Details
Closed on
Jun 28, 2012
Sold by
Mjk Joshuas Home Llc
Bought by
Jyv & Kim Llc
Purchase Details
Closed on
Oct 4, 2011
Sold by
Midfirst Bank
Bought by
Secretary Of Housing And Urban and C/O Us Dept Of Hud
Purchase Details
Closed on
Jul 28, 2003
Sold by
Miller Jack T and Miller Candace D
Bought by
West Raymond C
Home Financials for this Owner
Home Financials are based on the most recent Mortgage that was taken out on this home.
Original Mortgage
$104,362
Interest Rate
5.17%
Mortgage Type
FHA
Purchase Details
Closed on
Oct 13, 1999
Sold by
Miller Jack T
Bought by
Miller Candace D
Create a Home Valuation Report for This Property
The Home Valuation Report is an in-depth analysis detailing your home's value as well as a comparison with similar homes in the area
Home Values in the Area
Average Home Value in this Area
Purchase History
| Date | Buyer | Sale Price | Title Company |
|---|---|---|---|
| Hernandez Jose A Alcala | $230,000 | -- | |
| Comfortable Creation Llc | $45,500 | -- | |
| Jyv & Kim Llc | $20,600 | -- | |
| Mjk Joshuas Home Llc | $20,600 | -- | |
| Secretary Of Housing And Urban | $111,703 | -- | |
| Midfirst Bank | $111,703 | -- | |
| West Raymond C | $106,000 | -- | |
| Miller Candace D | -- | -- |
Source: Public Records
Mortgage History
| Date | Status | Borrower | Loan Amount |
|---|---|---|---|
| Open | Hernandez Jose A Alcala | $225,834 | |
| Previous Owner | West Raymond C | $104,362 |
Source: Public Records
Tax History Compared to Growth
Tax History
| Year | Tax Paid | Tax Assessment Tax Assessment Total Assessment is a certain percentage of the fair market value that is determined by local assessors to be the total taxable value of land and additions on the property. | Land | Improvement |
|---|---|---|---|---|
| 2024 | $3,673 | $97,880 | $19,080 | $78,800 |
| 2023 | $3,492 | $85,120 | $15,200 | $69,920 |
| 2022 | $2,891 | $69,960 | $15,080 | $54,880 |
| 2021 | $2,219 | $53,720 | $8,000 | $45,720 |
| 2020 | $1,960 | $46,000 | $8,000 | $38,000 |
| 2019 | $1,799 | $40,080 | $7,200 | $32,880 |
| 2018 | $1,275 | $28,280 | $4,680 | $23,600 |
| 2017 | $1,205 | $26,480 | $4,680 | $21,800 |
| 2016 | $1,001 | $22,000 | $4,680 | $17,320 |
| 2015 | $394 | $8,640 | $4,680 | $3,960 |
| 2014 | $378 | $8,200 | $3,960 | $4,240 |
| 2013 | -- | $31,640 | $8,760 | $22,880 |
Source: Public Records
Map
Nearby Homes
- 2987 Landmark Dr SE
- 665 Huron Ct SE
- 549 Greenview Ave SE
- 3027 Lakeridge Dr SE
- 3021 Lakeridge Dr SE
- 2910 Stanton Rd SE
- 3014 Lakeridge Dr SE
- 726 Shoreline Trail SE
- 2851 Stanton Rd SE
- 693 Deering Rd SE
- 3165 Goode Rd
- 574 Almand Branch Rd SE Unit 1
- 812 Raintree Way SE
- 2923 Raintree Dr SE
- 2924 Raintree Dr SE
- 2717 Stanton Woods Dr SE
- 820 Bridgewater Way SE
- 1813 Holmsey Cir
- 2617 Laurel Woods Ln SE Unit 3
- 1511 Hillside Dr SE
- 569 Lakeridge Cir SE Unit 26f
- 569 Lakeridge Cir SE
- 573 Lakeridge Cir SE
- 565 Lakeridge Cir SE
- 3000 Stanton Rd SE Unit 1
- 3006 Stanton Rd SE
- 577 Lakeridge Cir SE Unit 2
- 551 Lakeridge Dr SE
- 570 Lakeridge Cir SE
- 3014 Stanton Rd SE
- 579 Lakeridge Dr SE Unit 2
- 574 Lakeridge Cir SE
- 3022 Stanton Rd SE
- 562 Lakeridge Dr SE
- 581 Lakeridge Cir SE Unit 2
- 568 Lakeridge Dr SE
- 574 Lakeridge Dr SE
- 587 Seneca Ct SE
- 3030 Stanton Rd SE
- 550 Lakeridge Dr SE