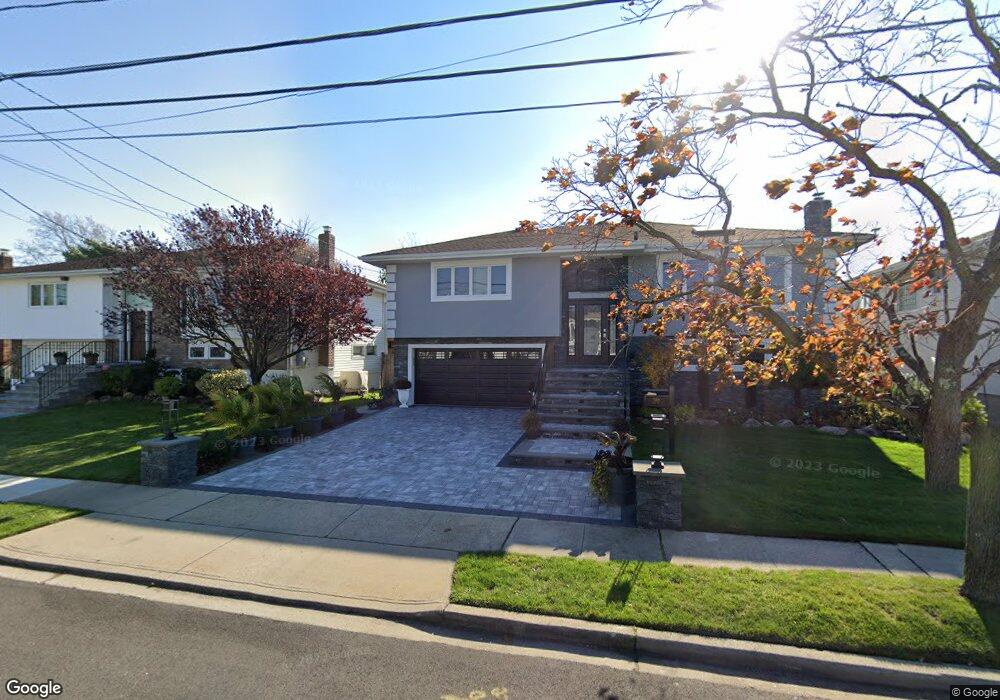
569 Links Dr S Oceanside, NY 11572
Estimated Value: $917,842 - $920,000
4
Beds
3
Baths
1,558
Sq Ft
$590/Sq Ft
Est. Value
About This Home
This home is located at 569 Links Dr S, Oceanside, NY 11572 and is currently estimated at $918,921, approximately $589 per square foot. 569 Links Dr S is a home located in Nassau County with nearby schools including Boardman Elementary School, Oceanside Middle School, and Oceanside High School.
Ownership History
Date
Name
Owned For
Owner Type
Purchase Details
Closed on
Nov 30, 2020
Sold by
Unger Neil
Bought by
Unger Neil and Rosa Unger Lissette
Current Estimated Value
Purchase Details
Closed on
Sep 17, 2014
Sold by
Pepino Nancy L and Pepino William H
Bought by
Unger Neil
Home Financials for this Owner
Home Financials are based on the most recent Mortgage that was taken out on this home.
Original Mortgage
$463,500
Outstanding Balance
$354,446
Interest Rate
4.11%
Mortgage Type
Purchase Money Mortgage
Estimated Equity
$564,475
Purchase Details
Closed on
Jul 28, 1997
Sold by
Zellman Walter
Bought by
Pepino Nancy L
Create a Home Valuation Report for This Property
The Home Valuation Report is an in-depth analysis detailing your home's value as well as a comparison with similar homes in the area
Home Values in the Area
Average Home Value in this Area
Purchase History
| Date | Buyer | Sale Price | Title Company |
|---|---|---|---|
| Unger Neil | -- | None Available | |
| Unger Neil | $515,000 | None Available | |
| Pepino Nancy L | $265,000 | -- |
Source: Public Records
Mortgage History
| Date | Status | Borrower | Loan Amount |
|---|---|---|---|
| Open | Unger Neil | $463,500 |
Source: Public Records
Tax History Compared to Growth
Tax History
| Year | Tax Paid | Tax Assessment Tax Assessment Total Assessment is a certain percentage of the fair market value that is determined by local assessors to be the total taxable value of land and additions on the property. | Land | Improvement |
|---|---|---|---|---|
| 2025 | $15,491 | $561 | $219 | $342 |
| 2024 | $4,623 | $590 | $230 | $360 |
| 2023 | $13,463 | $604 | $236 | $368 |
| 2022 | $13,463 | $607 | $237 | $370 |
| 2021 | $17,559 | $587 | $229 | $358 |
| 2020 | $12,080 | $721 | $720 | $1 |
| 2019 | $11,009 | $773 | $736 | $37 |
| 2018 | $11,174 | $824 | $0 | $0 |
| 2017 | $7,330 | $876 | $611 | $265 |
| 2016 | $11,339 | $1,125 | $785 | $340 |
| 2015 | $4,918 | $1,125 | $727 | $398 |
| 2014 | $4,918 | $1,125 | $727 | $398 |
| 2013 | $4,572 | $1,125 | $727 | $398 |
Source: Public Records
Map
Nearby Homes
- 341 Green Ct
- 487 Links Dr E
- 3665 Carrel Blvd
- 243 Mott St
- 237 Mott St
- 3461 Ocean Ave
- 3822 Greentree Dr
- 3666 Illona Ln
- 3452 Ocean Ave
- 189 Philips Place
- 3391 Fairway Rd
- 64 Wexford Ln
- 3843 Sally Ln
- 24 Strangford Ct
- 3515 Oceanside Rd
- 163 Mott St
- 313 Jordan St
- 3924 Jane Ln
- 3309 Skillman Ave
- 3420 Woodward St