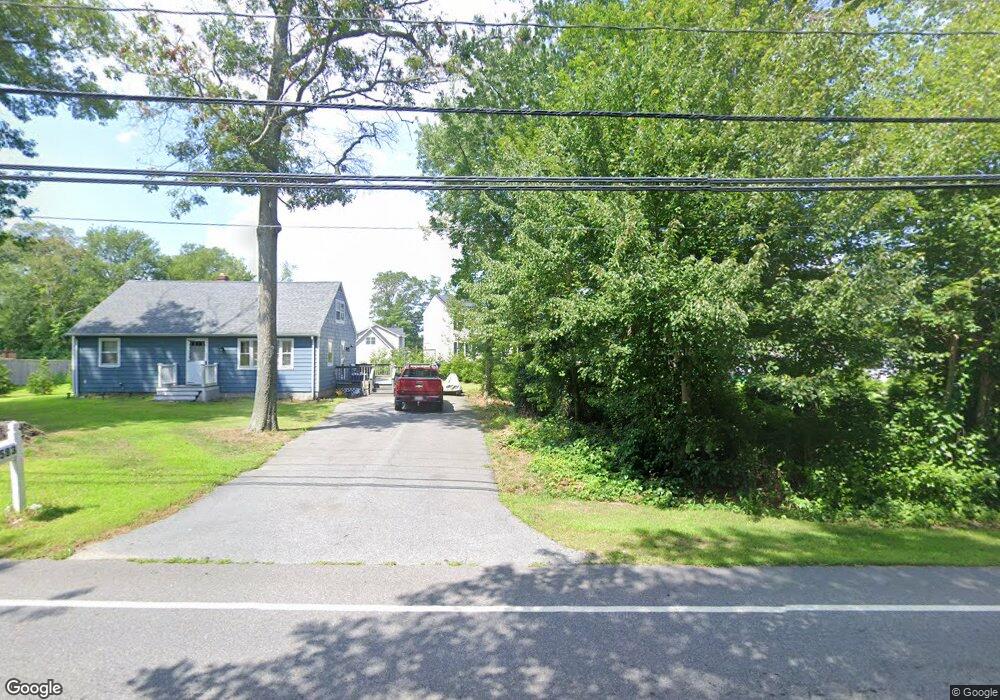
569 Locust St Swansea, MA 02777
West Swansea NeighborhoodEstimated Value: $607,000 - $687,000
3
Beds
3
Baths
2,120
Sq Ft
$310/Sq Ft
Est. Value
About This Home
This home is located at 569 Locust St, Swansea, MA 02777 and is currently estimated at $658,089, approximately $310 per square foot. 569 Locust St is a home located in Bristol County with nearby schools including Joseph Case High School and Swansea Wood School.
Ownership History
Date
Name
Owned For
Owner Type
Purchase Details
Closed on
Jan 20, 2017
Sold by
Viveiros George and Viveiros Kimberly
Bought by
Costa Development Llc
Current Estimated Value
Purchase Details
Closed on
Sep 29, 2011
Sold by
Tecumseh Rt
Bought by
Viveiros George and Viveiros Kimberly
Purchase Details
Closed on
Sep 17, 2009
Sold by
Viveiros George and Viveiros Kimberly
Bought by
Tecumseh Rt
Purchase Details
Closed on
Mar 13, 2006
Sold by
Souza Jeffrey
Bought by
Viveiros George and Viveiros Kimberly
Home Financials for this Owner
Home Financials are based on the most recent Mortgage that was taken out on this home.
Original Mortgage
$113,500
Interest Rate
6.15%
Mortgage Type
Purchase Money Mortgage
Create a Home Valuation Report for This Property
The Home Valuation Report is an in-depth analysis detailing your home's value as well as a comparison with similar homes in the area
Home Values in the Area
Average Home Value in this Area
Purchase History
| Date | Buyer | Sale Price | Title Company |
|---|---|---|---|
| Costa Development Llc | $100,000 | -- | |
| Viveiros George | -- | -- | |
| Tecumseh Rt | $280,000 | -- | |
| Viveiros George | $150,000 | -- |
Source: Public Records
Mortgage History
| Date | Status | Borrower | Loan Amount |
|---|---|---|---|
| Previous Owner | Viveiros George | $113,500 |
Source: Public Records
Tax History Compared to Growth
Tax History
| Year | Tax Paid | Tax Assessment Tax Assessment Total Assessment is a certain percentage of the fair market value that is determined by local assessors to be the total taxable value of land and additions on the property. | Land | Improvement |
|---|---|---|---|---|
| 2025 | $6,282 | $527,000 | $177,000 | $350,000 |
| 2024 | $6,259 | $522,000 | $177,000 | $345,000 |
| 2023 | $5,500 | $418,900 | $130,000 | $288,900 |
| 2022 | $5,205 | $361,700 | $118,300 | $243,400 |
| 2021 | $4,997 | $319,700 | $118,300 | $201,400 |
| 2020 | $4,964 | $318,600 | $117,800 | $200,800 |
| 2019 | $4,926 | $317,600 | $105,100 | $212,500 |
| 2018 | $4,792 | $313,600 | $103,400 | $210,200 |
| 2017 | $4,133 | $311,200 | $103,400 | $207,800 |
| 2016 | $3,961 | $293,000 | $89,100 | $203,900 |
| 2015 | $3,842 | $292,600 | $89,100 | $203,500 |
| 2014 | $3,561 | $277,300 | $89,100 | $188,200 |
Source: Public Records
Map
Nearby Homes