Estimated Value: $111,000 - $144,000
3
Beds
1
Bath
1,024
Sq Ft
$130/Sq Ft
Est. Value
About This Home
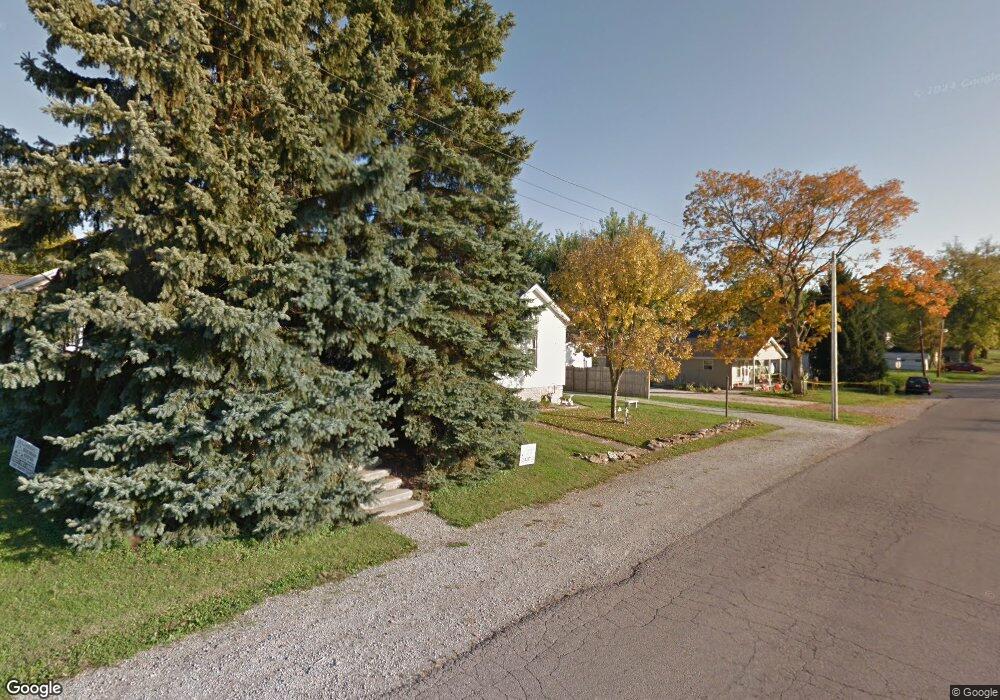
This home is located at 569 Lynn St, Xenia, OH 45385 and is currently estimated at $132,935, approximately $129 per square foot. 569 Lynn St is a home located in Greene County with nearby schools including Xenia High School, Summit Academy Community School for Alternative Learners - Xenia, and Legacy Christian Academy.
Ownership History
Date
Name
Owned For
Owner Type
Purchase Details
Closed on
Feb 25, 2010
Sold by
Federal Home Loan Mortgage Corporation
Bought by
Keller Thomas J and Keller Sharon L
Current Estimated Value
Purchase Details
Closed on
Oct 29, 2009
Sold by
Ledbetter Brian C and Ledbetter Kelly R
Bought by
Federal Home Loan Mortgage Corporation
Purchase Details
Closed on
Oct 20, 1997
Sold by
Kiskis James J
Bought by
Ledbetter Brian C and Ledbetter R
Home Financials for this Owner
Home Financials are based on the most recent Mortgage that was taken out on this home.
Original Mortgage
$54,400
Interest Rate
7.65%
Mortgage Type
FHA
Create a Home Valuation Report for This Property
The Home Valuation Report is an in-depth analysis detailing your home's value as well as a comparison with similar homes in the area
Home Values in the Area
Average Home Value in this Area
Purchase History
| Date | Buyer | Sale Price | Title Company |
|---|---|---|---|
| Keller Thomas J | $22,600 | Attorney | |
| Federal Home Loan Mortgage Corporation | $34,000 | Attorney | |
| Ledbetter Brian C | $55,000 | -- |
Source: Public Records
Mortgage History
| Date | Status | Borrower | Loan Amount |
|---|---|---|---|
| Previous Owner | Ledbetter Brian C | $18,000 | |
| Previous Owner | Ledbetter Brian C | $57,000 | |
| Previous Owner | Ledbetter Brian C | $54,400 |
Source: Public Records
Tax History Compared to Growth
Tax History
| Year | Tax Paid | Tax Assessment Tax Assessment Total Assessment is a certain percentage of the fair market value that is determined by local assessors to be the total taxable value of land and additions on the property. | Land | Improvement |
|---|---|---|---|---|
| 2024 | $1,298 | $30,330 | $5,210 | $25,120 |
| 2023 | $1,298 | $30,330 | $5,210 | $25,120 |
| 2022 | $1,142 | $22,770 | $4,170 | $18,600 |
| 2021 | $1,158 | $22,770 | $4,170 | $18,600 |
| 2020 | $1,109 | $22,770 | $4,170 | $18,600 |
| 2019 | $923 | $17,840 | $4,710 | $13,130 |
| 2018 | $927 | $17,840 | $4,710 | $13,130 |
| 2017 | $900 | $17,840 | $4,710 | $13,130 |
| 2016 | $894 | $16,890 | $4,710 | $12,180 |
| 2015 | $897 | $16,890 | $4,710 | $12,180 |
| 2014 | $859 | $16,890 | $4,710 | $12,180 |
Source: Public Records
Map
Nearby Homes