Estimated Value: $229,000 - $255,000
3
Beds
2
Baths
1,540
Sq Ft
$156/Sq Ft
Est. Value
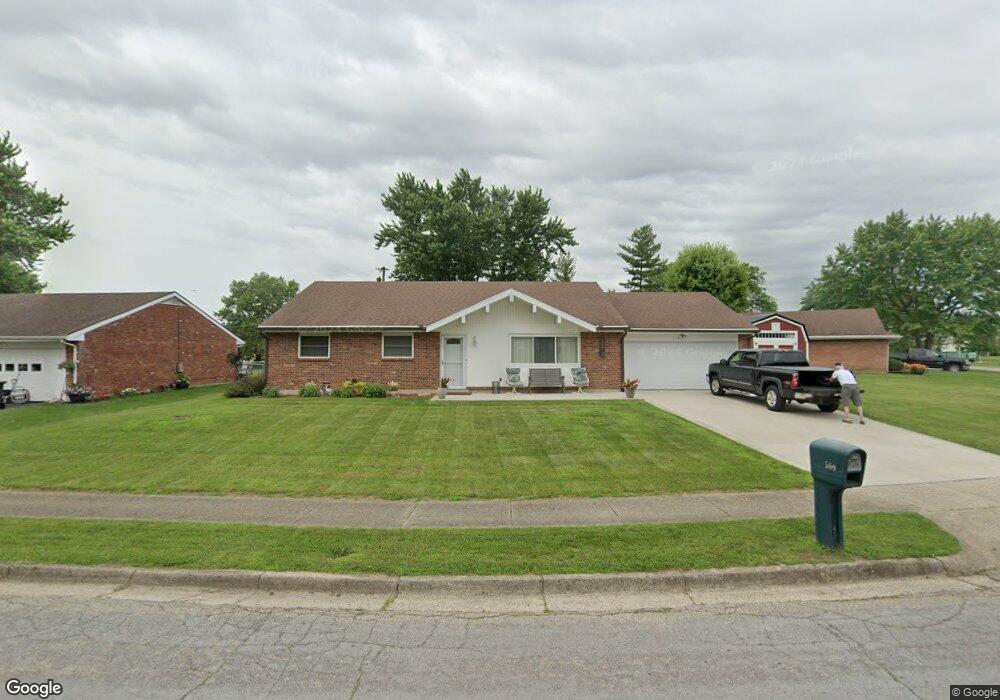
About This Home
This home is located at 569 Martin Dr, Xenia, OH 45385 and is currently estimated at $240,632, approximately $156 per square foot. 569 Martin Dr is a home located in Greene County with nearby schools including Xenia High School, Summit Academy Community School for Alternative Learners - Xenia, and Legacy Christian Academy.
Ownership History
Date
Name
Owned For
Owner Type
Purchase Details
Closed on
Oct 9, 2019
Sold by
Molitor David F and Molitor Mary L
Bought by
Tackett Bennie and Tackett Mary
Current Estimated Value
Home Financials for this Owner
Home Financials are based on the most recent Mortgage that was taken out on this home.
Original Mortgage
$121,500
Outstanding Balance
$106,765
Interest Rate
3.65%
Mortgage Type
New Conventional
Estimated Equity
$133,867
Purchase Details
Closed on
Aug 11, 2006
Sold by
Pickering Kathryn L and Flege Virginia M
Bought by
Molitor David F and Molitor Mary L
Home Financials for this Owner
Home Financials are based on the most recent Mortgage that was taken out on this home.
Original Mortgage
$60,000
Interest Rate
6.83%
Mortgage Type
Unknown
Purchase Details
Closed on
Oct 6, 1999
Sold by
Miller Eleanor R
Bought by
Pickering Kathryn L and Flege Virginia M
Purchase Details
Closed on
Mar 22, 1999
Sold by
Estate Of Harold W Miller
Bought by
Miller Eleanor R
Create a Home Valuation Report for This Property
The Home Valuation Report is an in-depth analysis detailing your home's value as well as a comparison with similar homes in the area
Home Values in the Area
Average Home Value in this Area
Purchase History
| Date | Buyer | Sale Price | Title Company |
|---|---|---|---|
| Tackett Bennie | $135,000 | None Available | |
| Molitor David F | $100,000 | None Available | |
| Pickering Kathryn L | $106,900 | -- | |
| Miller Eleanor R | -- | -- |
Source: Public Records
Mortgage History
| Date | Status | Borrower | Loan Amount |
|---|---|---|---|
| Open | Tackett Bennie | $121,500 | |
| Previous Owner | Molitor David F | $60,000 |
Source: Public Records
Tax History Compared to Growth
Tax History
| Year | Tax Paid | Tax Assessment Tax Assessment Total Assessment is a certain percentage of the fair market value that is determined by local assessors to be the total taxable value of land and additions on the property. | Land | Improvement |
|---|---|---|---|---|
| 2024 | $2,133 | $60,950 | $11,180 | $49,770 |
| 2023 | $2,133 | $60,950 | $11,180 | $49,770 |
| 2022 | $1,751 | $44,550 | $6,990 | $37,560 |
| 2021 | $1,775 | $44,550 | $6,990 | $37,560 |
| 2020 | $2,113 | $44,550 | $6,990 | $37,560 |
| 2019 | $1,500 | $38,510 | $8,120 | $30,390 |
| 2018 | $1,506 | $38,510 | $8,120 | $30,390 |
| 2017 | $1,324 | $38,510 | $8,120 | $30,390 |
| 2016 | $1,325 | $34,460 | $8,120 | $26,340 |
| 2015 | $1,328 | $34,460 | $8,120 | $26,340 |
| 2014 | $1,271 | $34,460 | $8,120 | $26,340 |
Source: Public Records
Map
Nearby Homes
- 1311 Eagles Way
- 1359 Eagles Way
- 1038 Frederick Dr
- 1171 N Detroit St
- 513 Redbud Ln
- 656 Eden Roc Dr
- 610 Saxony Dr
- 508 Marshall Dr
- 902 N Detroit St
- 878 N Detroit St
- 965 Oak Dale Dr
- 568 Louise Dr
- 659 N King St
- 479 N Stadium Dr
- 348 S Stadium Dr
- 516 N King St
- 613 N West St
- 983 Echo Ct
- 2018 Tahoe Dr
- 119 Park Dr