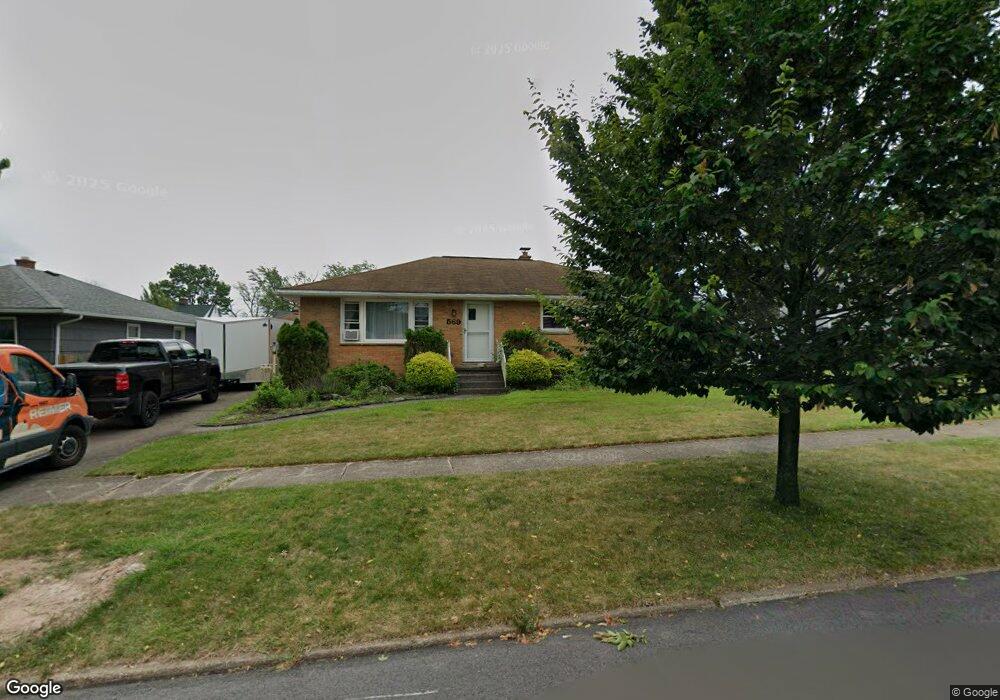
569 Morgan St Tonawanda, NY 14150
Estimated Value: $228,000 - $254,000
3
Beds
1
Bath
1,234
Sq Ft
$195/Sq Ft
Est. Value
About This Home
This home is located at 569 Morgan St, Tonawanda, NY 14150 and is currently estimated at $241,045, approximately $195 per square foot. 569 Morgan St is a home located in Erie County with nearby schools including Riverview Elementary School, Tonawanda Elementary School, and Tonawanda Middle High School.
Ownership History
Date
Name
Owned For
Owner Type
Purchase Details
Closed on
May 27, 2025
Sold by
Carter Lisa Marie
Bought by
Posenjak David and Maulucci Jessica
Current Estimated Value
Home Financials for this Owner
Home Financials are based on the most recent Mortgage that was taken out on this home.
Original Mortgage
$245,471
Outstanding Balance
$244,841
Interest Rate
6.81%
Mortgage Type
New Conventional
Estimated Equity
-$3,796
Purchase Details
Closed on
Sep 21, 2007
Sold by
Solada Leroy L and Solada Dorothy A
Bought by
Dipirro Suzanne and Burley Donald L
Create a Home Valuation Report for This Property
The Home Valuation Report is an in-depth analysis detailing your home's value as well as a comparison with similar homes in the area
Home Values in the Area
Average Home Value in this Area
Purchase History
| Date | Buyer | Sale Price | Title Company |
|---|---|---|---|
| Posenjak David | $250,000 | None Available | |
| Dipirro Suzanne | $115,000 | None Available | |
| Dipirro Suzanne | $115,000 | None Available |
Source: Public Records
Mortgage History
| Date | Status | Borrower | Loan Amount |
|---|---|---|---|
| Open | Posenjak David | $245,471 |
Source: Public Records
Tax History Compared to Growth
Tax History
| Year | Tax Paid | Tax Assessment Tax Assessment Total Assessment is a certain percentage of the fair market value that is determined by local assessors to be the total taxable value of land and additions on the property. | Land | Improvement |
|---|---|---|---|---|
| 2024 | $2,469 | $188,000 | $23,000 | $165,000 |
| 2023 | $683 | $188,000 | $23,000 | $165,000 |
| 2022 | $2,362 | $121,000 | $14,600 | $106,400 |
| 2021 | $2,352 | $121,000 | $14,600 | $106,400 |
| 2020 | $543 | $121,000 | $14,600 | $106,400 |
| 2019 | $2,373 | $121,000 | $14,600 | $106,400 |
| 2018 | $505 | $121,000 | $14,600 | $106,400 |
| 2017 | $611 | $101,000 | $12,200 | $88,800 |
| 2016 | $325 | $101,000 | $12,200 | $88,800 |
| 2015 | -- | $101,000 | $12,200 | $88,800 |
| 2014 | -- | $101,000 | $12,200 | $88,800 |
Source: Public Records
Map
Nearby Homes