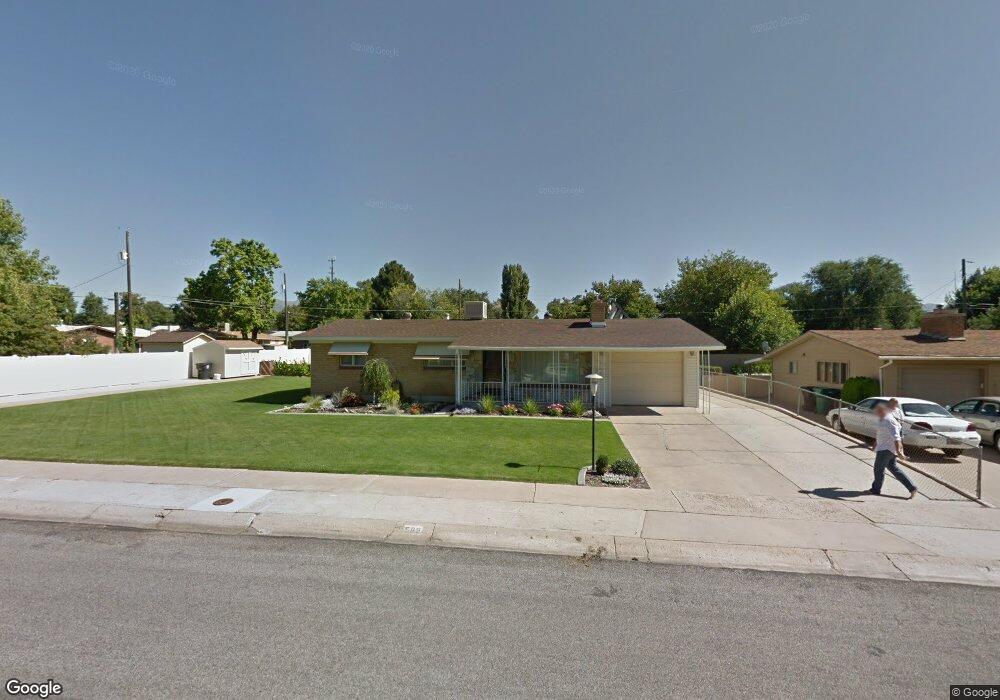
569 N 200 W Clearfield, UT 84015
Estimated Value: $354,000 - $403,413
3
Beds
2
Baths
1,540
Sq Ft
$246/Sq Ft
Est. Value
About This Home
This home is located at 569 N 200 W, Clearfield, UT 84015 and is currently estimated at $378,353, approximately $245 per square foot. 569 N 200 W is a home located in Davis County with nearby schools including Doxey School, North Davis Junior High School, and Clearfield High School.
Ownership History
Date
Name
Owned For
Owner Type
Purchase Details
Closed on
Mar 18, 2014
Sold by
Butler Jansi and Butler Jacob
Bought by
Maxfield Tylor
Current Estimated Value
Home Financials for this Owner
Home Financials are based on the most recent Mortgage that was taken out on this home.
Original Mortgage
$5,636
Outstanding Balance
$4,298
Interest Rate
4.5%
Mortgage Type
FHA
Estimated Equity
$374,055
Purchase Details
Closed on
May 14, 2011
Sold by
Konrad Deanna T
Bought by
Butler Jansi and Butler Jacob
Home Financials for this Owner
Home Financials are based on the most recent Mortgage that was taken out on this home.
Original Mortgage
$128,017
Interest Rate
5.25%
Mortgage Type
FHA
Purchase Details
Closed on
May 6, 2011
Sold by
Day Debra T
Bought by
Butler Jansi and Butler Jacob
Home Financials for this Owner
Home Financials are based on the most recent Mortgage that was taken out on this home.
Original Mortgage
$128,017
Interest Rate
5.25%
Mortgage Type
FHA
Purchase Details
Closed on
May 5, 2011
Sold by
Ostler Kathleen T and Sanders Dauna T
Bought by
Butler Jansi and Butler Jacob
Home Financials for this Owner
Home Financials are based on the most recent Mortgage that was taken out on this home.
Original Mortgage
$128,017
Interest Rate
5.25%
Mortgage Type
FHA
Purchase Details
Closed on
Apr 21, 2011
Sold by
Butler Jacob and Butler Jansi
Bought by
Butler Jansi and Butler Jacob
Home Financials for this Owner
Home Financials are based on the most recent Mortgage that was taken out on this home.
Original Mortgage
$128,017
Interest Rate
5.25%
Mortgage Type
FHA
Purchase Details
Closed on
Aug 9, 2007
Sold by
Crippen Deanna T and Day Debra T
Bought by
Butler Jacob and Butler Jansi
Home Financials for this Owner
Home Financials are based on the most recent Mortgage that was taken out on this home.
Original Mortgage
$105,000
Interest Rate
6.73%
Mortgage Type
Purchase Money Mortgage
Purchase Details
Closed on
Oct 27, 2005
Sold by
Thurgood D Howard and Thurgood Reta
Bought by
Thurgood David Howard and Thurgood Reta B
Create a Home Valuation Report for This Property
The Home Valuation Report is an in-depth analysis detailing your home's value as well as a comparison with similar homes in the area
Home Values in the Area
Average Home Value in this Area
Purchase History
| Date | Buyer | Sale Price | Title Company |
|---|---|---|---|
| Maxfield Tylor | -- | None Available | |
| Butler Jansi | -- | Mountain View Title | |
| Butler Jansi | -- | Mountain View Title | |
| Butler Jansi | -- | Mountain View Title | |
| Butler Jansi | -- | Mountain View Title | |
| Butler Jacob | -- | Mountain View Title & Escrow | |
| Butler Jacob | -- | Mountain View Title & Escrow | |
| Thurgood David Howard | -- | -- |
Source: Public Records
Mortgage History
| Date | Status | Borrower | Loan Amount |
|---|---|---|---|
| Open | Maxfield Tylor | $5,636 | |
| Previous Owner | Butler Jansi | $128,017 | |
| Previous Owner | Butler Jacob | $105,000 |
Source: Public Records
Tax History Compared to Growth
Tax History
| Year | Tax Paid | Tax Assessment Tax Assessment Total Assessment is a certain percentage of the fair market value that is determined by local assessors to be the total taxable value of land and additions on the property. | Land | Improvement |
|---|---|---|---|---|
| 2025 | $2,179 | $195,250 | $88,743 | $106,507 |
| 2024 | $2,126 | $191,950 | $84,711 | $107,239 |
| 2023 | $1,974 | $327,000 | $133,767 | $193,233 |
| 2022 | $1,958 | $175,450 | $75,021 | $100,429 |
| 2021 | $1,780 | $241,000 | $89,018 | $151,982 |
| 2020 | $1,547 | $208,000 | $76,722 | $131,278 |
| 2019 | $1,514 | $201,000 | $73,754 | $127,246 |
| 2018 | $1,361 | $176,000 | $62,191 | $113,809 |
| 2016 | $1,191 | $80,520 | $26,776 | $53,744 |
| 2015 | $1,138 | $73,370 | $26,776 | $46,594 |
| 2014 | $1,143 | $74,677 | $26,776 | $47,901 |
| 2013 | -- | $70,167 | $25,887 | $44,280 |
Source: Public Records
Map
Nearby Homes