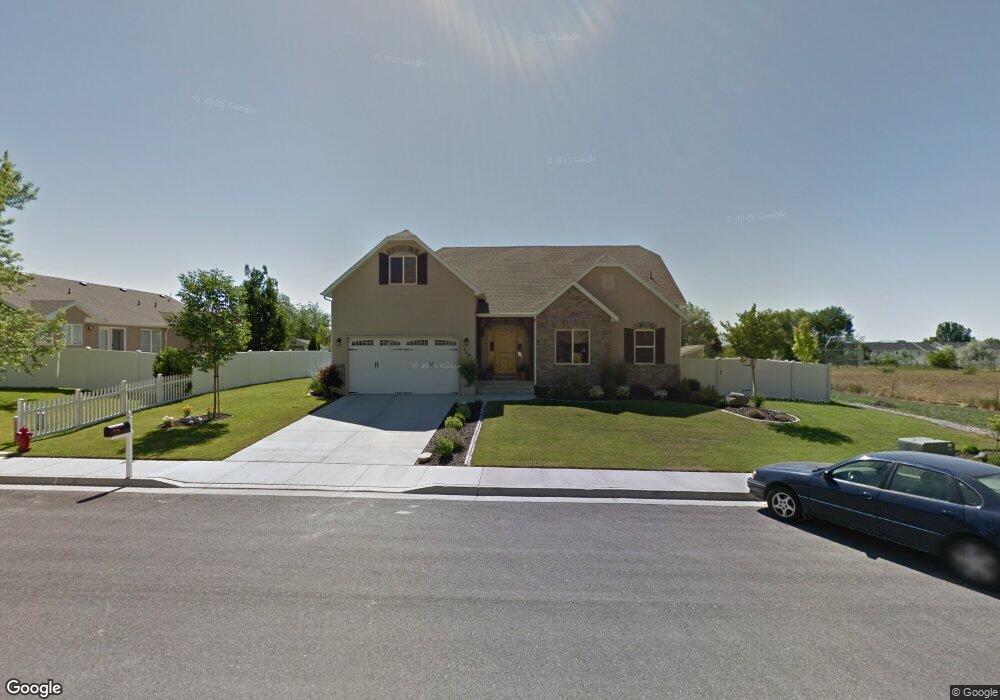
569 N 350 E Springville, UT 84663
Little Rock Canyon NeighborhoodEstimated Value: $611,389 - $752,000
5
Beds
3
Baths
2,532
Sq Ft
$267/Sq Ft
Est. Value
About This Home
This home is located at 569 N 350 E, Springville, UT 84663 and is currently estimated at $677,130, approximately $267 per square foot. 569 N 350 E is a home located in Utah County with nearby schools including Cherry Creek Elementary School, Springville Junior High School, and Springville High School.
Ownership History
Date
Name
Owned For
Owner Type
Purchase Details
Closed on
Apr 20, 2007
Sold by
Peay Craig R
Bought by
Craig R Peay Construction Inc
Current Estimated Value
Home Financials for this Owner
Home Financials are based on the most recent Mortgage that was taken out on this home.
Original Mortgage
$272,000
Outstanding Balance
$164,006
Interest Rate
6.1%
Mortgage Type
Purchase Money Mortgage
Estimated Equity
$513,124
Purchase Details
Closed on
Apr 19, 2007
Sold by
Craig R Peay Construction Inc
Bought by
Parker Craig M and Parker Judy K
Home Financials for this Owner
Home Financials are based on the most recent Mortgage that was taken out on this home.
Original Mortgage
$272,000
Outstanding Balance
$164,006
Interest Rate
6.1%
Mortgage Type
Purchase Money Mortgage
Estimated Equity
$513,124
Purchase Details
Closed on
Sep 19, 2006
Sold by
Peay Craig R
Bought by
Peay Craig R
Create a Home Valuation Report for This Property
The Home Valuation Report is an in-depth analysis detailing your home's value as well as a comparison with similar homes in the area
Home Values in the Area
Average Home Value in this Area
Purchase History
| Date | Buyer | Sale Price | Title Company |
|---|---|---|---|
| Craig R Peay Construction Inc | -- | Security Title & Abstract | |
| Parker Craig M | -- | Security Title & Abstract | |
| Peay Craig R | -- | Security Title & Abstract |
Source: Public Records
Mortgage History
| Date | Status | Borrower | Loan Amount |
|---|---|---|---|
| Open | Parker Craig M | $272,000 |
Source: Public Records
Tax History
| Year | Tax Paid | Tax Assessment Tax Assessment Total Assessment is a certain percentage of the fair market value that is determined by local assessors to be the total taxable value of land and additions on the property. | Land | Improvement |
|---|---|---|---|---|
| 2025 | $3,089 | $323,290 | -- | -- |
| 2024 | $3,089 | $316,415 | $0 | $0 |
| 2023 | $3,151 | $323,125 | $0 | $0 |
| 2022 | $3,016 | $303,710 | $0 | $0 |
| 2021 | $2,649 | $415,200 | $123,700 | $291,500 |
| 2020 | $2,544 | $386,700 | $103,100 | $283,600 |
| 2019 | $2,453 | $379,600 | $96,000 | $283,600 |
| 2018 | $2,491 | $367,700 | $85,300 | $282,400 |
| 2017 | $2,494 | $195,580 | $0 | $0 |
| 2016 | $2,328 | $178,970 | $0 | $0 |
| 2015 | $2,098 | $164,890 | $0 | $0 |
| 2014 | $1,952 | $152,405 | $0 | $0 |
Source: Public Records
Map
Nearby Homes
- 343 E 550 N
- 589 N 350 E Unit LOT 19
- 574 N 235 E Unit LOT 9
- 558 N 235 E Unit LOT 8
- 588 N 235 E Unit LOT 10
- 566 N 350 E
- 626 N 235 E Unit LOT 11
- 358 E 550 N
- 586 N 350 E
- 534 N 350 E
- 377 E 550 N
- 523 N 350 E
- 544 N 235 E Unit LOT 7
- 347 E 625 N Unit LOT 17
- 373 E 625 N
- 278 E 700 N Unit LOT 12
- 278 E 700 N
- 376 E 550 N
- 369 E 625 N Unit LOT 16
- 272 E 550 N
Your Personal Tour Guide
Ask me questions while you tour the home.