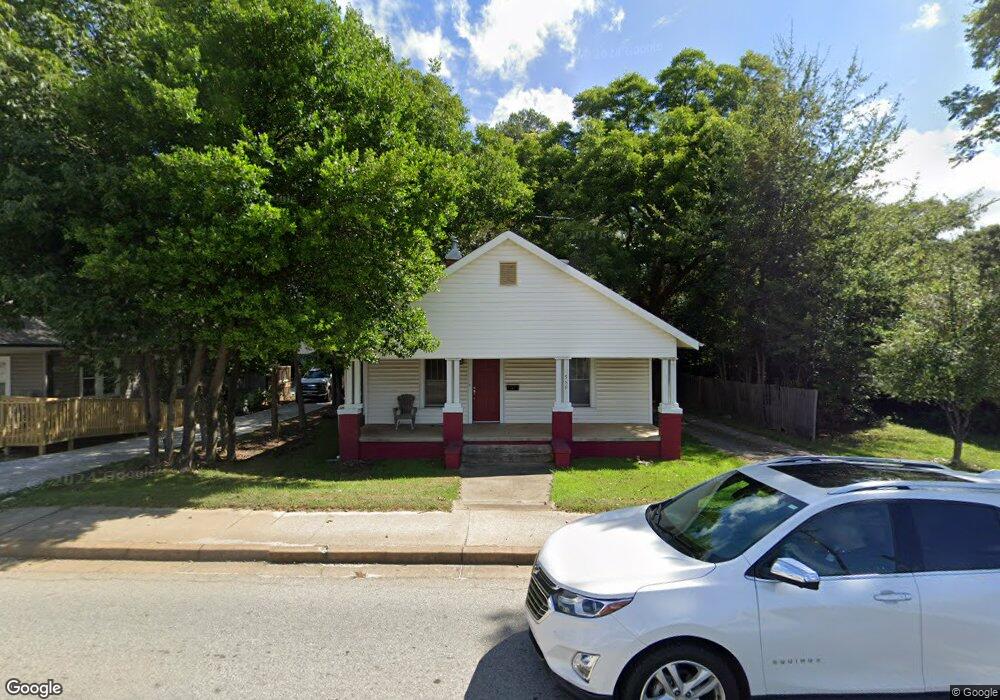
569 N Main St Woodruff, SC 29388
Estimated Value: $139,715 - $196,000
3
Beds
1
Bath
1,424
Sq Ft
$118/Sq Ft
Est. Value
About This Home
This home is located at 569 N Main St, Woodruff, SC 29388 and is currently estimated at $167,679, approximately $117 per square foot. 569 N Main St is a home located in Spartanburg County with nearby schools including Woodruff Primary School, Woodruff Elementary School, and Woodruff Middle School.
Ownership History
Date
Name
Owned For
Owner Type
Purchase Details
Closed on
Dec 16, 2019
Sold by
Southern Palmetto Investments Llc
Bought by
Dorsey Mykel H
Current Estimated Value
Home Financials for this Owner
Home Financials are based on the most recent Mortgage that was taken out on this home.
Original Mortgage
$103,030
Outstanding Balance
$91,013
Interest Rate
3.7%
Mortgage Type
New Conventional
Estimated Equity
$76,666
Purchase Details
Closed on
Jul 1, 2010
Sold by
Spartanburg County Forfeited Land Commis
Bought by
Southern Palmetto Investments Llc
Purchase Details
Closed on
Jun 29, 2010
Sold by
Stephenson Justin L and Stephenson Crystal R
Bought by
Spartanburg County Forfeited Land Commis
Purchase Details
Closed on
Oct 25, 2001
Sold by
Stern Ricklin J
Bought by
Lanford Terry G
Create a Home Valuation Report for This Property
The Home Valuation Report is an in-depth analysis detailing your home's value as well as a comparison with similar homes in the area
Home Values in the Area
Average Home Value in this Area
Purchase History
| Date | Buyer | Sale Price | Title Company |
|---|---|---|---|
| Dorsey Mykel H | $102,000 | None Available | |
| Southern Palmetto Investments Llc | $2,534 | -- | |
| Spartanburg County Forfeited Land Commis | -- | -- | |
| Lanford Terry G | $53,500 | -- |
Source: Public Records
Mortgage History
| Date | Status | Borrower | Loan Amount |
|---|---|---|---|
| Open | Dorsey Mykel H | $103,030 |
Source: Public Records
Tax History Compared to Growth
Tax History
| Year | Tax Paid | Tax Assessment Tax Assessment Total Assessment is a certain percentage of the fair market value that is determined by local assessors to be the total taxable value of land and additions on the property. | Land | Improvement |
|---|---|---|---|---|
| 2025 | $2,853 | $6,084 | $780 | $5,304 |
| 2024 | $2,853 | $6,084 | $780 | $5,304 |
| 2023 | $2,853 | $6,084 | $780 | $5,304 |
| 2022 | $2,829 | $6,114 | $720 | $5,394 |
| 2021 | $2,840 | $6,114 | $720 | $5,394 |
| 2020 | $2,750 | $6,114 | $720 | $5,394 |
| 2019 | $1,873 | $4,116 | $720 | $3,396 |
| 2018 | $1,860 | $4,116 | $720 | $3,396 |
| 2017 | $1,736 | $3,780 | $720 | $3,060 |
| 2016 | $1,715 | $3,780 | $720 | $3,060 |
| 2015 | $1,705 | $3,780 | $720 | $3,060 |
| 2014 | $1,670 | $3,780 | $720 | $3,060 |
Source: Public Records
Map
Nearby Homes