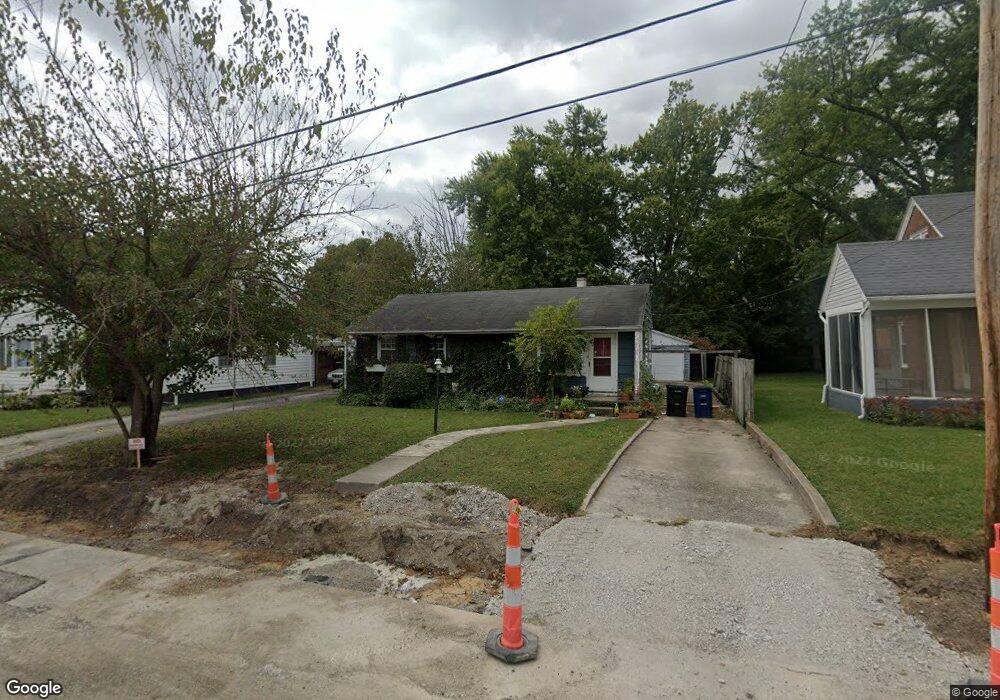
569 N Mulberry St Wilmington, OH 45177
Estimated Value: $147,000 - $176,000
3
Beds
1
Bath
912
Sq Ft
$178/Sq Ft
Est. Value
About This Home
This home is located at 569 N Mulberry St, Wilmington, OH 45177 and is currently estimated at $161,882, approximately $177 per square foot. 569 N Mulberry St is a home located in Clinton County with nearby schools including East End Elementary School, Denver Place Elementary School, and Roy E. Holmes Elementary School.
Ownership History
Date
Name
Owned For
Owner Type
Purchase Details
Closed on
Feb 27, 2004
Sold by
Rauch Craig H
Bought by
Jenkins Michael C and Jenkins Michael B
Current Estimated Value
Home Financials for this Owner
Home Financials are based on the most recent Mortgage that was taken out on this home.
Original Mortgage
$74,500
Outstanding Balance
$34,989
Interest Rate
5.74%
Mortgage Type
Purchase Money Mortgage
Estimated Equity
$126,893
Purchase Details
Closed on
Jan 1, 1990
Bought by
Rauch Craig H
Create a Home Valuation Report for This Property
The Home Valuation Report is an in-depth analysis detailing your home's value as well as a comparison with similar homes in the area
Home Values in the Area
Average Home Value in this Area
Purchase History
| Date | Buyer | Sale Price | Title Company |
|---|---|---|---|
| Jenkins Michael C | $74,500 | -- | |
| Rauch Craig H | -- | -- |
Source: Public Records
Mortgage History
| Date | Status | Borrower | Loan Amount |
|---|---|---|---|
| Open | Jenkins Michael C | $74,500 |
Source: Public Records
Tax History Compared to Growth
Tax History
| Year | Tax Paid | Tax Assessment Tax Assessment Total Assessment is a certain percentage of the fair market value that is determined by local assessors to be the total taxable value of land and additions on the property. | Land | Improvement |
|---|---|---|---|---|
| 2024 | $1,154 | $34,370 | $6,860 | $27,510 |
| 2023 | $1,154 | $34,370 | $6,860 | $27,510 |
| 2022 | $923 | $25,880 | $6,230 | $19,650 |
| 2021 | $934 | $25,880 | $6,230 | $19,650 |
| 2020 | $878 | $25,880 | $6,230 | $19,650 |
| 2019 | $781 | $21,030 | $6,830 | $14,200 |
| 2018 | $789 | $21,030 | $6,830 | $14,200 |
| 2017 | $767 | $21,030 | $6,830 | $14,200 |
| 2016 | $746 | $20,210 | $6,140 | $14,070 |
| 2015 | $734 | $20,210 | $6,140 | $14,070 |
| 2013 | $770 | $20,950 | $6,140 | $14,810 |
Source: Public Records
Map
Nearby Homes
- 555 N Mulberry St
- 579 N Mulberry St
- 545 N Mulberry St
- 556 N Mulberry St
- 597 N Mulberry St
- 566 N Spring St
- 578 N Spring St
- 556 N Spring St
- 588 N Mulberry St
- 564 N Mulberry St
- 576 N Mulberry St
- 594 N Mulberry St
- 609 N Mulberry St
- 534 N Mulberry St
- 596 N Spring St
- 105 Fulton St
- 546 N Mulberry St
- 127 Fulton St
- 135 Fulton St
- 619 N Mulberry St