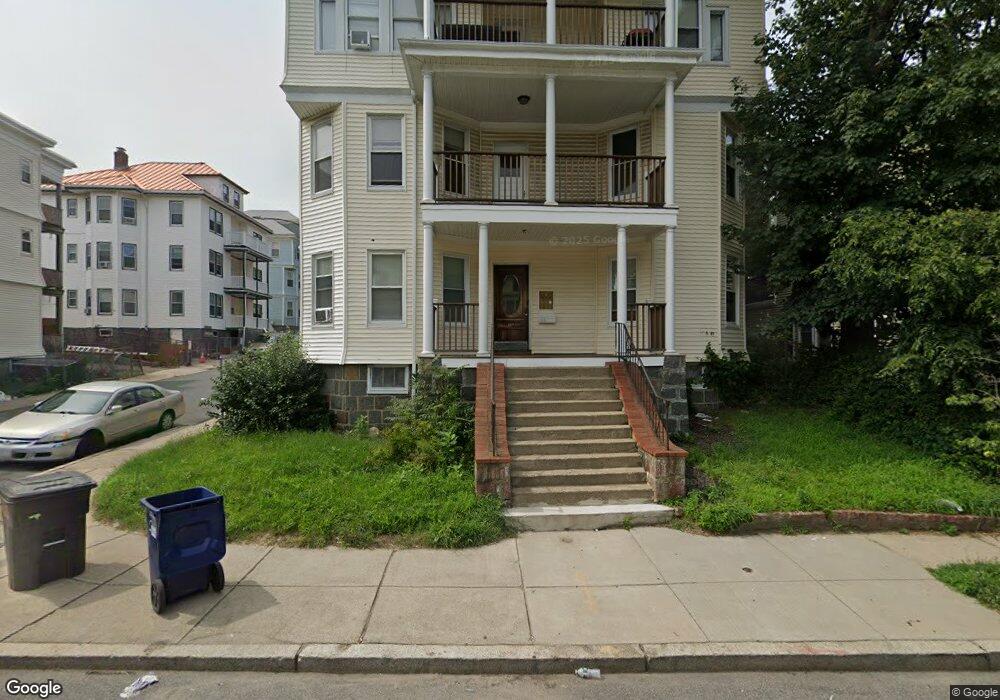
569 Norfolk St Mattapan, MA 02126
Wellington Hill NeighborhoodEstimated Value: $1,037,000 - $1,154,000
4
Beds
3
Baths
1,050
Sq Ft
$1,036/Sq Ft
Est. Value
About This Home
This home is located at 569 Norfolk St, Mattapan, MA 02126 and is currently estimated at $1,087,334, approximately $1,035 per square foot. 569 Norfolk St is a home located in Suffolk County with nearby schools including KIPP Academy Boston Charter School and Berea Seventh-day Adventist Academy.
Ownership History
Date
Name
Owned For
Owner Type
Purchase Details
Closed on
Nov 16, 2022
Sold by
Kirkland Bernadine B
Bought by
569 Norfolk Street Llc
Current Estimated Value
Home Financials for this Owner
Home Financials are based on the most recent Mortgage that was taken out on this home.
Original Mortgage
$885,000
Outstanding Balance
$855,715
Interest Rate
6.94%
Mortgage Type
Purchase Money Mortgage
Estimated Equity
$231,619
Purchase Details
Closed on
Jan 30, 2004
Sold by
Blacknell-Bryant Sharon E and Blacknall Joseph Ee
Bought by
Kirkland Carlos D and Kirkland Bernadine B
Home Financials for this Owner
Home Financials are based on the most recent Mortgage that was taken out on this home.
Original Mortgage
$295,000
Interest Rate
5.65%
Create a Home Valuation Report for This Property
The Home Valuation Report is an in-depth analysis detailing your home's value as well as a comparison with similar homes in the area
Home Values in the Area
Average Home Value in this Area
Purchase History
| Date | Buyer | Sale Price | Title Company |
|---|---|---|---|
| 569 Norfolk Street Llc | $950,000 | None Available | |
| Kirkland Carlos D | $368,750 | -- |
Source: Public Records
Mortgage History
| Date | Status | Borrower | Loan Amount |
|---|---|---|---|
| Open | 569 Norfolk Street Llc | $885,000 | |
| Previous Owner | Kirkland Carlos D | $295,000 | |
| Previous Owner | Kirkland Carlos D | $295,000 |
Source: Public Records
Tax History Compared to Growth
Tax History
| Year | Tax Paid | Tax Assessment Tax Assessment Total Assessment is a certain percentage of the fair market value that is determined by local assessors to be the total taxable value of land and additions on the property. | Land | Improvement |
|---|---|---|---|---|
| 2025 | $9,924 | $857,000 | $216,400 | $640,600 |
| 2024 | $9,449 | $866,900 | $209,500 | $657,400 |
| 2023 | $8,722 | $812,100 | $195,800 | $616,300 |
| 2022 | $8,032 | $738,200 | $178,000 | $560,200 |
| 2021 | $7,877 | $738,200 | $178,000 | $560,200 |
| 2020 | $5,782 | $547,500 | $189,700 | $357,800 |
| 2019 | $5,246 | $497,700 | $137,200 | $360,500 |
| 2018 | $4,655 | $444,200 | $137,200 | $307,000 |
| 2017 | $4,612 | $435,500 | $137,200 | $298,300 |
| 2016 | $4,355 | $395,900 | $137,200 | $258,700 |
| 2015 | $4,360 | $360,000 | $108,200 | $251,800 |
| 2014 | $4,044 | $321,500 | $108,200 | $213,300 |
Source: Public Records
Map
Nearby Homes
- 567B Norfolk St
- 25 Fessenden St
- 23 Fessenden St
- 710 Walk Hill St
- 45 1st Ave Unit 111
- 12 Hiawatha Rd
- 157 Delhi St
- 49 Fottler Rd
- 10 Itasca St
- 11 French St
- 4 Crossman St Unit 4
- 10 Hosmer St
- 32 Violet St
- 1465 Blue Hill Ave
- 116 Almont St
- 18 Astoria St
- 20 Monterey Ave
- 10 Sutton St
- 60 and 64 Monterey Ave
- 5 Sutton St
- 569 Norfolk St
- 569 Norfolk St Unit 2
- 569 Norfolk St Unit 3
- 569 Norfolk St Unit 1
- 30 Wilmore St
- 567 Norfolk St
- 571 Norfolk St
- 27 Wilmore St
- 27 Wilmore St Unit 2
- 570 Norfolk St
- 570 Norfolk St Unit 1
- 26 Wilmore St Unit 2
- 26 Wilmore St
- 26 Wilmore St Unit Apartment
- 26 Wilmore St Unit 3
- 574 Norfolk St
- 568 Norfolk St
- 23 Wilmore St Unit 1
- 23 Wilmore St
- 23 Wilmore St Unit 2