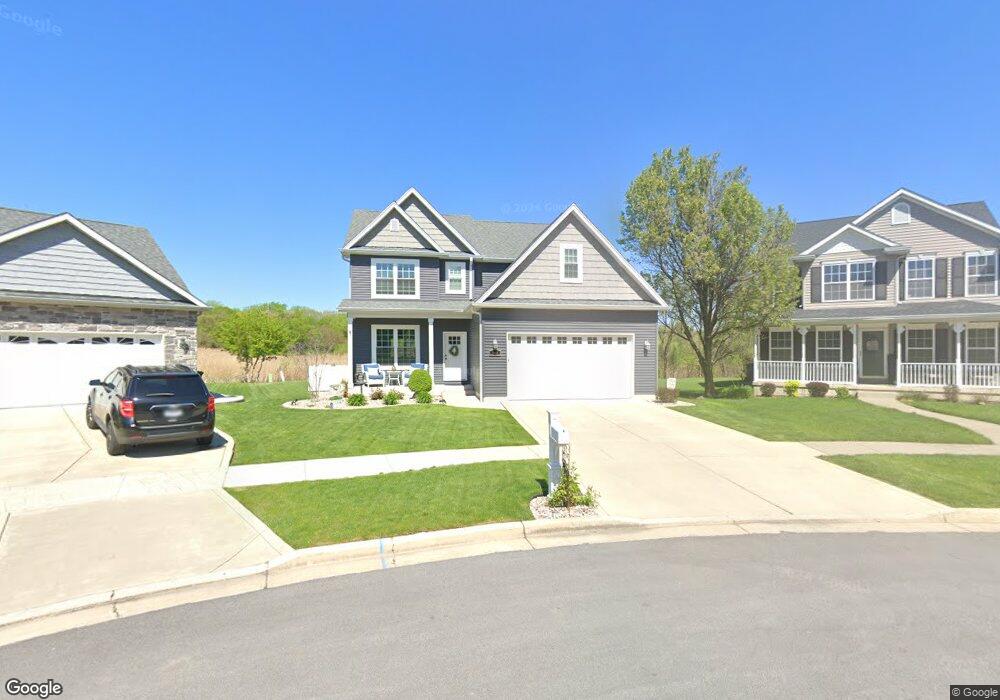
569 O Hagan Dr Crown Point, IN 46307
Estimated Value: $406,805 - $535,000
3
Beds
3
Baths
1,958
Sq Ft
$241/Sq Ft
Est. Value
About This Home
This home is located at 569 O Hagan Dr, Crown Point, IN 46307 and is currently estimated at $471,451, approximately $240 per square foot. 569 O Hagan Dr is a home located in Lake County with nearby schools including Lake Street Elementary School, Robert Taft Middle School, and Crown Point High School.
Ownership History
Date
Name
Owned For
Owner Type
Purchase Details
Closed on
Jun 7, 2019
Sold by
Heidler Elissa and Baccino Christopher
Bought by
Lindholm Scott A and Kepchar Alice J
Current Estimated Value
Home Financials for this Owner
Home Financials are based on the most recent Mortgage that was taken out on this home.
Original Mortgage
$248,160
Outstanding Balance
$218,631
Interest Rate
4.2%
Mortgage Type
New Conventional
Estimated Equity
$252,820
Purchase Details
Closed on
Jul 13, 2012
Sold by
New Castle Homes Llc
Bought by
Heidler Elissa and Baccino Christopher
Home Financials for this Owner
Home Financials are based on the most recent Mortgage that was taken out on this home.
Original Mortgage
$183,923
Interest Rate
3.64%
Mortgage Type
New Conventional
Purchase Details
Closed on
Mar 22, 2012
Sold by
Rohaley Daniel M
Bought by
New Castle Homes Llc
Create a Home Valuation Report for This Property
The Home Valuation Report is an in-depth analysis detailing your home's value as well as a comparison with similar homes in the area
Home Values in the Area
Average Home Value in this Area
Purchase History
| Date | Buyer | Sale Price | Title Company |
|---|---|---|---|
| Lindholm Scott A | -- | Community Title Company | |
| Heidler Elissa | -- | Multiple | |
| New Castle Homes Llc | -- | Fidelity National Title Co |
Source: Public Records
Mortgage History
| Date | Status | Borrower | Loan Amount |
|---|---|---|---|
| Open | Lindholm Scott A | $248,160 | |
| Previous Owner | Heidler Elissa | $183,923 |
Source: Public Records
Tax History Compared to Growth
Tax History
| Year | Tax Paid | Tax Assessment Tax Assessment Total Assessment is a certain percentage of the fair market value that is determined by local assessors to be the total taxable value of land and additions on the property. | Land | Improvement |
|---|---|---|---|---|
| 2024 | $9,224 | $371,300 | $64,300 | $307,000 |
| 2023 | $3,695 | $335,600 | $55,100 | $280,500 |
| 2022 | $3,695 | $320,100 | $55,100 | $265,000 |
| 2021 | $3,282 | $294,700 | $42,800 | $251,900 |
| 2020 | $3,234 | $290,500 | $42,800 | $247,700 |
| 2019 | $3,310 | $293,200 | $42,800 | $250,400 |
| 2018 | $4,123 | $295,800 | $42,800 | $253,000 |
| 2017 | $3,784 | $272,600 | $42,800 | $229,800 |
| 2016 | $3,741 | $266,200 | $42,800 | $223,400 |
| 2014 | $3,419 | $261,300 | $42,800 | $218,500 |
| 2013 | $3,334 | $253,600 | $42,800 | $210,800 |
Source: Public Records
Map
Nearby Homes
- 908 Mary Ellen Dr
- 11341 Lakewood St
- 629 W South St
- 775 Quinlan Ct
- 804 Shannon Dr
- 312 Fairfield Dr
- 334 Ellendale Pkwy
- 321 Bluebird Ave
- 1 Walnut Pkwy
- 1140 Hyde Park
- 114 S Chase Dr
- 1089 George Ade Ct
- 1156 Donegal Ln
- 316 W South St
- 11531 Westvalley Dr
- 1144 Mary Ellen Dr
- 802 Hayfield Dr
- 744 S Court St
- 3709 W 121st Ave
- 11606 Westvalley Dr
- 569 O'Hagan Dr
- 575 O Hagan Dr
- 563 O Hagan Dr
- 581 O'Hagan Dr
- 557 O Hagan Dr
- 587 O Hagan Dr
- Lot 17 O'Hagan Dr
- Lot H22 O'Hagan Dr
- Lot H26 O'Hagan Dr
- Lot H24 O'Hagan Dr
- Lot H2 O'Hagan Dr
- Lot H10 O'Hagan Dr
- Lot O'Hagan Dr
- Lot O'Hagan Dr
- 24-Lot O'Hagan Dr
- 18-Lot O'Hagan Dr
- 8-Lot O'Hagan Dr
- 604-Lot H24 O'Hagan Dr
- 423-Lot H2 O'Hagan Dr
- 487-Lot H10 O'Hagan Dr