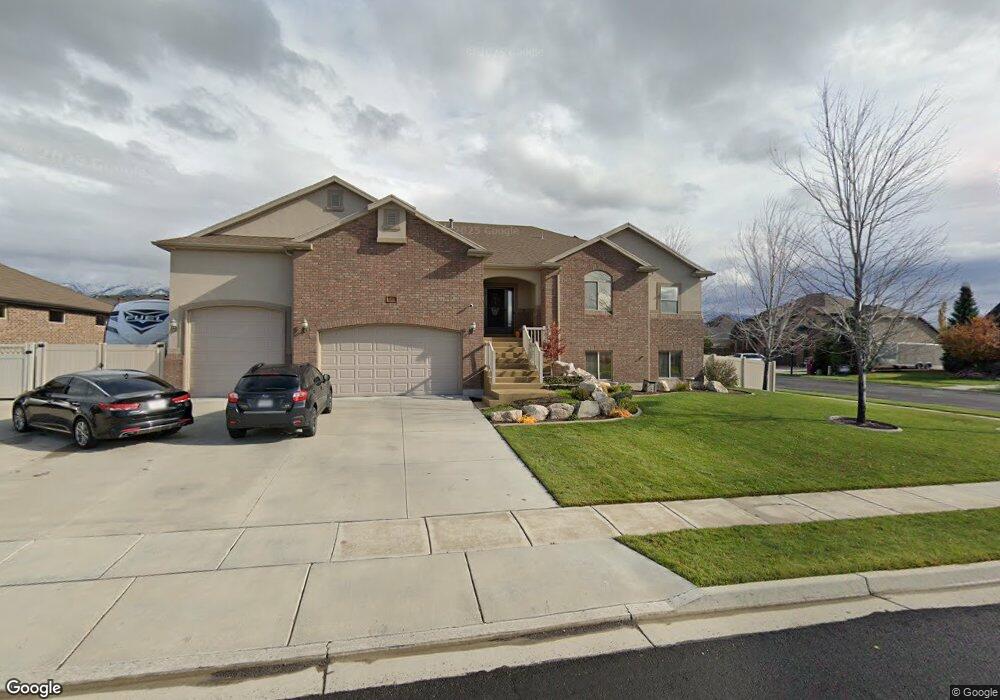
569 S 1700 W Layton, UT 84041
Estimated Value: $789,000 - $809,000
5
Beds
4
Baths
3,798
Sq Ft
$211/Sq Ft
Est. Value
About This Home
This home is located at 569 S 1700 W, Layton, UT 84041 and is currently estimated at $801,595, approximately $211 per square foot. 569 S 1700 W is a home located in Davis County with nearby schools including Shoreline Junior High School, Layton High School, and North Davis Preparatory Academy.
Ownership History
Date
Name
Owned For
Owner Type
Purchase Details
Closed on
Jun 15, 2021
Sold by
Randolph Carrie Ann
Bought by
Gordon And Carrie Randolph Family Trust and Randolph
Current Estimated Value
Home Financials for this Owner
Home Financials are based on the most recent Mortgage that was taken out on this home.
Original Mortgage
$669,566
Outstanding Balance
$604,887
Interest Rate
2.9%
Mortgage Type
VA
Estimated Equity
$196,708
Purchase Details
Closed on
Dec 1, 2011
Sold by
Castle Creek Homes Llc
Bought by
Randolph Gordon E and Randolph Carrie
Home Financials for this Owner
Home Financials are based on the most recent Mortgage that was taken out on this home.
Original Mortgage
$176,162
Interest Rate
4.06%
Mortgage Type
New Conventional
Purchase Details
Closed on
Feb 1, 2010
Sold by
Northland Properties Lc
Bought by
Randolph Gordon E and Randolph Carrie
Create a Home Valuation Report for This Property
The Home Valuation Report is an in-depth analysis detailing your home's value as well as a comparison with similar homes in the area
Home Values in the Area
Average Home Value in this Area
Purchase History
| Date | Buyer | Sale Price | Title Company |
|---|---|---|---|
| Gordon And Carrie Randolph Family Trust | -- | -- | |
| Cowles Michael | -- | Inwest Title Services | |
| Randolph Gordon E | -- | Mountain View Title | |
| Randolph Gordon F | -- | Legends Title Llc | |
| Randolph Gordon E | -- | Mountain View Title | |
| Randolph Gordon E | -- | Mountain View Title |
Source: Public Records
Mortgage History
| Date | Status | Borrower | Loan Amount |
|---|---|---|---|
| Open | Cowles Michael | $669,566 | |
| Previous Owner | Randolph Gordon F | $176,162 |
Source: Public Records
Tax History Compared to Growth
Tax History
| Year | Tax Paid | Tax Assessment Tax Assessment Total Assessment is a certain percentage of the fair market value that is determined by local assessors to be the total taxable value of land and additions on the property. | Land | Improvement |
|---|---|---|---|---|
| 2025 | -- | $435,600 | $132,155 | $303,445 |
| 2024 | -- | $416,350 | $140,104 | $276,246 |
| 2023 | $1,303 | $730,000 | $151,081 | $578,919 |
| 2022 | $1,303 | $415,800 | $86,114 | $329,686 |
| 2021 | $0 | $489,000 | $129,138 | $359,862 |
| 2020 | $3,087 | $447,000 | $110,843 | $336,157 |
| 2019 | $2,799 | $397,000 | $108,337 | $288,663 |
| 2018 | $2,683 | $382,000 | $95,606 | $286,394 |
| 2016 | $2,690 | $197,560 | $40,349 | $157,211 |
| 2015 | $2,752 | $191,895 | $40,349 | $151,546 |
| 2014 | $2,914 | $207,769 | $40,349 | $167,420 |
| 2013 | -- | $177,100 | $42,700 | $134,400 |
Source: Public Records
Map
Nearby Homes
- 583 S Alberta Spruce Dr
- 796 S Rock Creek Corner
- 920 S 1700 W Unit 1
- 557 S Angel St
- 2182 W Evergreen Way Unit 143
- 37 N Swift Creek Dr
- 1124 S Neville St
- 1015 W 350 S
- 163 Cold Creek Way
- 1234 S Grace Way
- 296 S 950 W
- 2184 W Gentile St
- 362 S 950 W
- 1606 W 200 N
- 1042 W Shoreline Dr
- Creighton Farmhouse Plan at Angel Hill
- 306 S Sunburst Dr
- 1278 S Grace Way
- Browning Plan at Amber Fields
- Rhapsody Plan at Amber Fields
- 551 S 1700 W
- 572 S 1625 W
- 550 S 1625 W
- 550 S 1625 W Unit 239
- 533 S 1700 W
- 533 S 1700 W Unit 241
- 556 S 1700 W
- 574 S 1700 W
- 1685 W 600 S
- 1667 W 600 S
- 544 S 1700 W
- 598 S 1700 W
- 1645 W 600 S
- 513 S 1700 W
- 528 S 1700 W
- 573 S 1750 W
- 573 S Norway Spruce Dr
- 563 S Norway Spruce Dr
- 1665 W 500 S
- 1716 W Scottish Pine Way