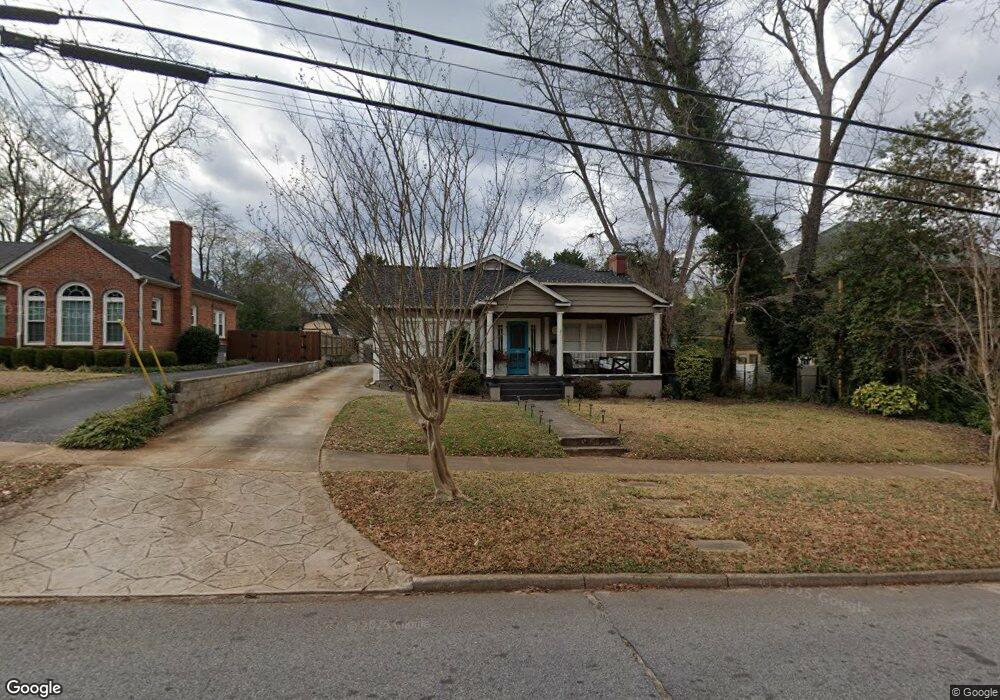
569 S 6th St Griffin, GA 30224
Spalding County NeighborhoodEstimated Value: $243,000 - $304,000
4
Beds
2
Baths
2,072
Sq Ft
$130/Sq Ft
Est. Value
About This Home
This home is located at 569 S 6th St, Griffin, GA 30224 and is currently estimated at $269,432, approximately $130 per square foot. 569 S 6th St is a home located in Spalding County with nearby schools including Crescent Road Elementary School, Rehoboth Road Middle School, and Spalding High School.
Ownership History
Date
Name
Owned For
Owner Type
Purchase Details
Closed on
Jun 12, 2007
Sold by
Allen Gergory S and Allen Linda S
Bought by
Robinson Jeremy B and Robinson Heather
Current Estimated Value
Home Financials for this Owner
Home Financials are based on the most recent Mortgage that was taken out on this home.
Original Mortgage
$99,000
Outstanding Balance
$60,348
Interest Rate
6.12%
Mortgage Type
New Conventional
Estimated Equity
$209,084
Purchase Details
Closed on
Aug 29, 1996
Sold by
Patrick Daniel W Christina
Bought by
Allen Gregory S Linda S
Purchase Details
Closed on
Apr 13, 1992
Sold by
Patrick David L
Bought by
Patrick Daniel Wade and Patrick Christina
Purchase Details
Closed on
Sep 3, 1965
Sold by
Hill Isaac N
Bought by
Patrick David L and Patrick Nell B
Purchase Details
Closed on
Feb 18, 1952
Bought by
Hill Isaac N
Create a Home Valuation Report for This Property
The Home Valuation Report is an in-depth analysis detailing your home's value as well as a comparison with similar homes in the area
Home Values in the Area
Average Home Value in this Area
Purchase History
| Date | Buyer | Sale Price | Title Company |
|---|---|---|---|
| Robinson Jeremy B | $130,000 | -- | |
| Allen Gregory S Linda S | $75,000 | -- | |
| Patrick Daniel Wade | -- | -- | |
| Patrick David L | -- | -- | |
| Patrick David L | $16,000 | -- | |
| Hill Isaac N | -- | -- |
Source: Public Records
Mortgage History
| Date | Status | Borrower | Loan Amount |
|---|---|---|---|
| Open | Robinson Jeremy B | $99,000 | |
| Closed | Allen Gregory S Linda S | $0 |
Source: Public Records
Tax History Compared to Growth
Tax History
| Year | Tax Paid | Tax Assessment Tax Assessment Total Assessment is a certain percentage of the fair market value that is determined by local assessors to be the total taxable value of land and additions on the property. | Land | Improvement |
|---|---|---|---|---|
| 2024 | $2,888 | $77,951 | $10,000 | $67,951 |
| 2023 | $2,888 | $75,540 | $10,000 | $65,540 |
| 2022 | $2,510 | $65,150 | $10,000 | $55,150 |
| 2021 | $2,181 | $56,924 | $10,000 | $46,924 |
| 2020 | $2,181 | $56,924 | $10,000 | $46,924 |
| 2019 | $2,228 | $57,085 | $10,000 | $47,085 |
| 2018 | $1,185 | $30,420 | $6,400 | $24,020 |
| 2017 | $1,159 | $30,420 | $6,400 | $24,020 |
| 2016 | $1,178 | $30,420 | $6,400 | $24,020 |
| 2015 | $1,198 | $30,420 | $6,400 | $24,020 |
| 2014 | $1,233 | $30,420 | $6,400 | $24,020 |
Source: Public Records
Map
Nearby Homes
- 541 S 6th St
- 523 S 6th St
- 134 Townsend Ct
- 18 Terracedale Ct
- 40 Terrace St
- 650 S Hill St
- 115 Kennelsman Dr Unit LOT FC 1
- 304 Tilney Ave
- 706 Maple Dr
- 714 Maple Dr
- 102 N Hill St Unit 304
- 102 N Hill St Unit 303
- 406 E Solomon St
- 320 S 12th St
- 811 Westbrook St
- 505 Kincaid Ave
- 754 Scales St
- 1541 Zebulon Rd & Unit 4 TRACTS 35 ACRES
- 524 Kincaid Ave
- 854 Scales St